Which of the following plots represents correctly the variation of equivalent conductance with dilution for a strong electrolyte ?
A

B

C

D

Text Solution
The correct Answer is:D
|
Topper's Solved these Questions
- ELECTROCHEMISTRYBOOK - MODERN PUBLICATIONCHAPTER - ELECTROCHEMISTRYEXERCISE - Multiple Choice Questions (Level-III) (Questions from AIEEE/JEE Examinations)
10 Videos
- ELECTROCHEMISTRYBOOK - MODERN PUBLICATIONCHAPTER - ELECTROCHEMISTRYEXERCISE - Recent Examination Questions
17 Videos
- ELECTROCHEMISTRYBOOK - MODERN PUBLICATIONCHAPTER - ELECTROCHEMISTRYEXERCISE - Recent Examination Questions
17 Videos
- COORDINATION COMPOUNDSBOOK - MODERN PUBLICATIONCHAPTER - COORDINATION COMPOUNDSEXERCISE - Recent Examination Questions
21 Videos
- ENVIROMENTAL POLLUTIONBOOK - MODERN PUBLICATIONCHAPTER - ENVIROMENTAL POLLUTIONEXERCISE - RECENT EXAMINATION QUESTIOS
2 Videos
Similar Questions
Knowledge Check
Which of the following plots represents correctly variation of equivalent conductance (Λ) with dilution for a strong electrolyte ?
A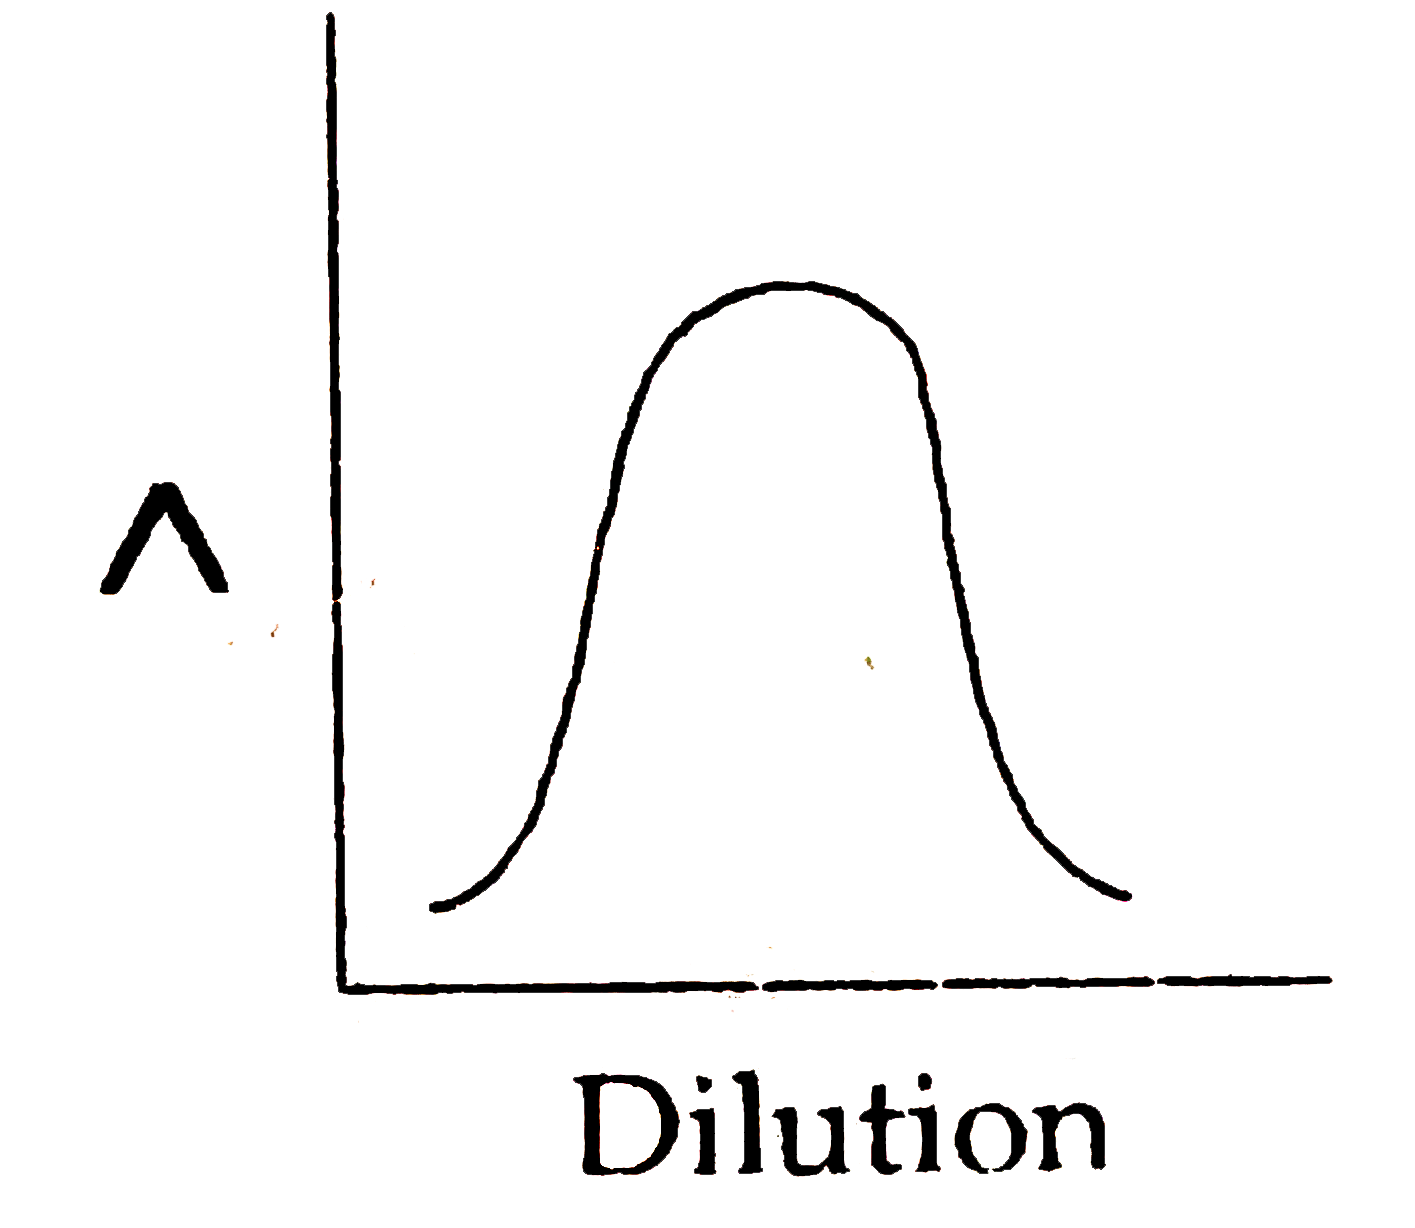 B
B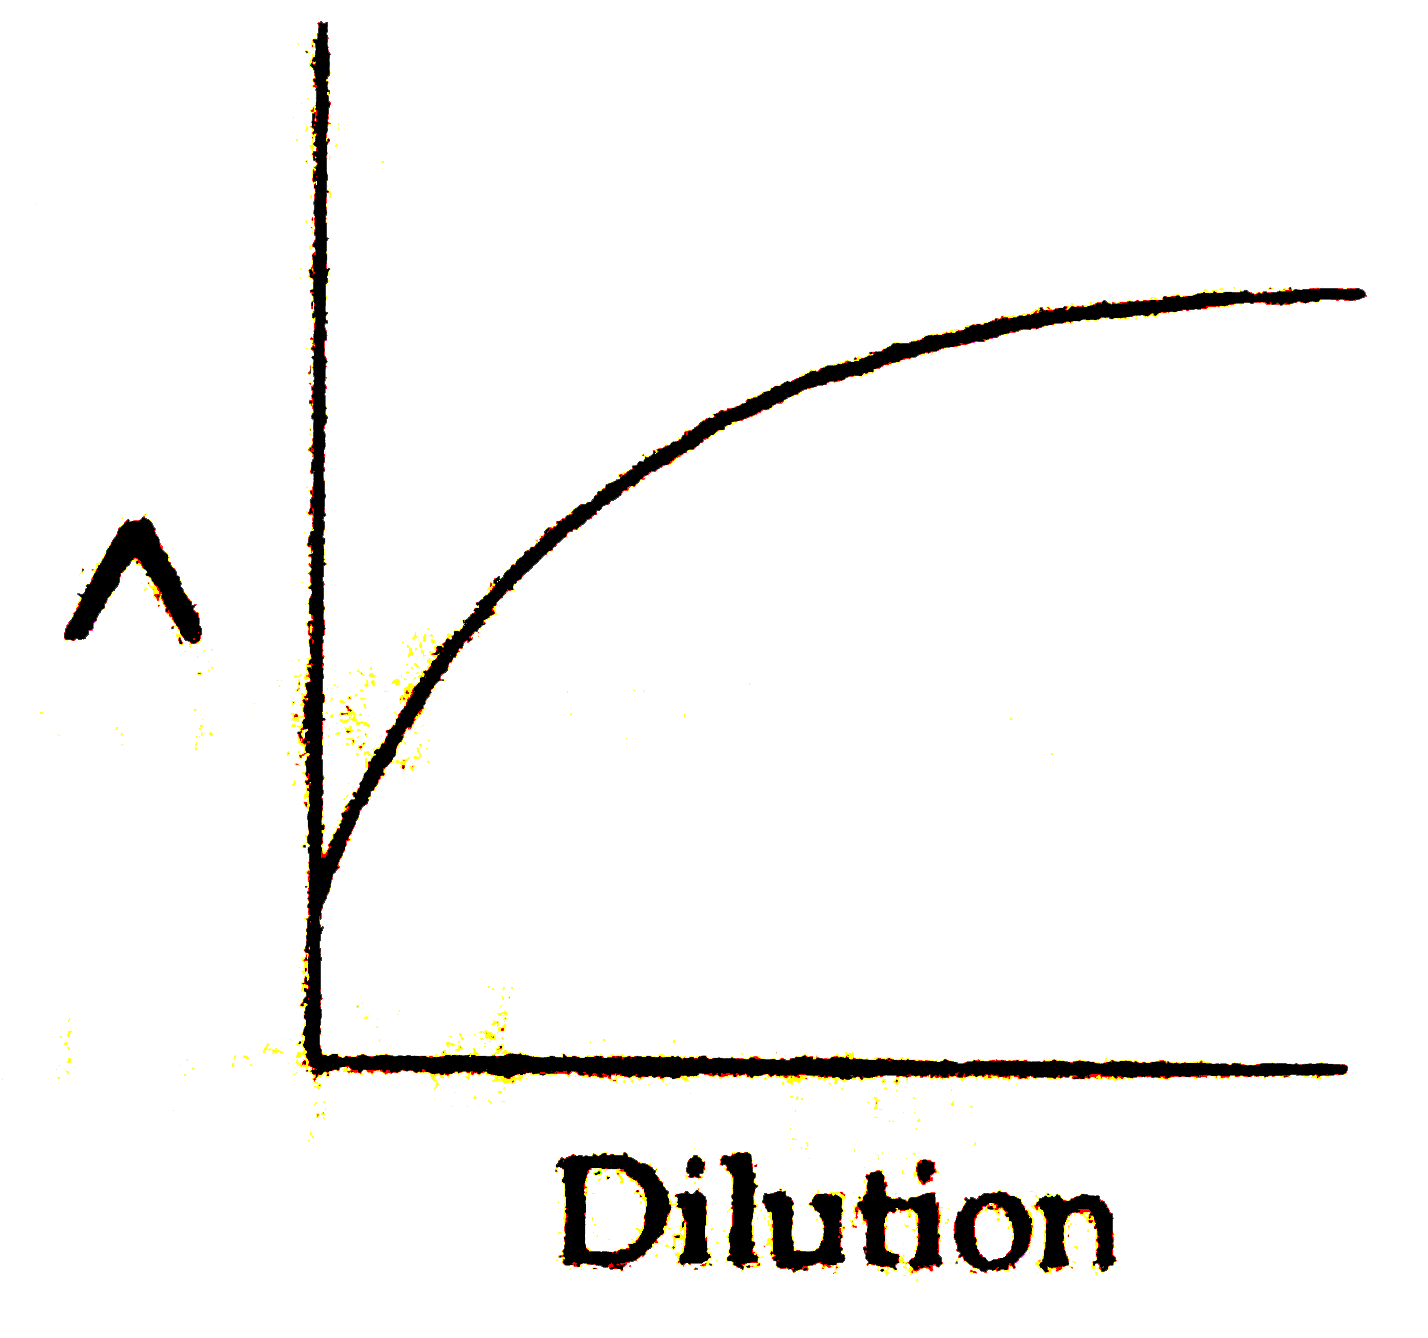 C
C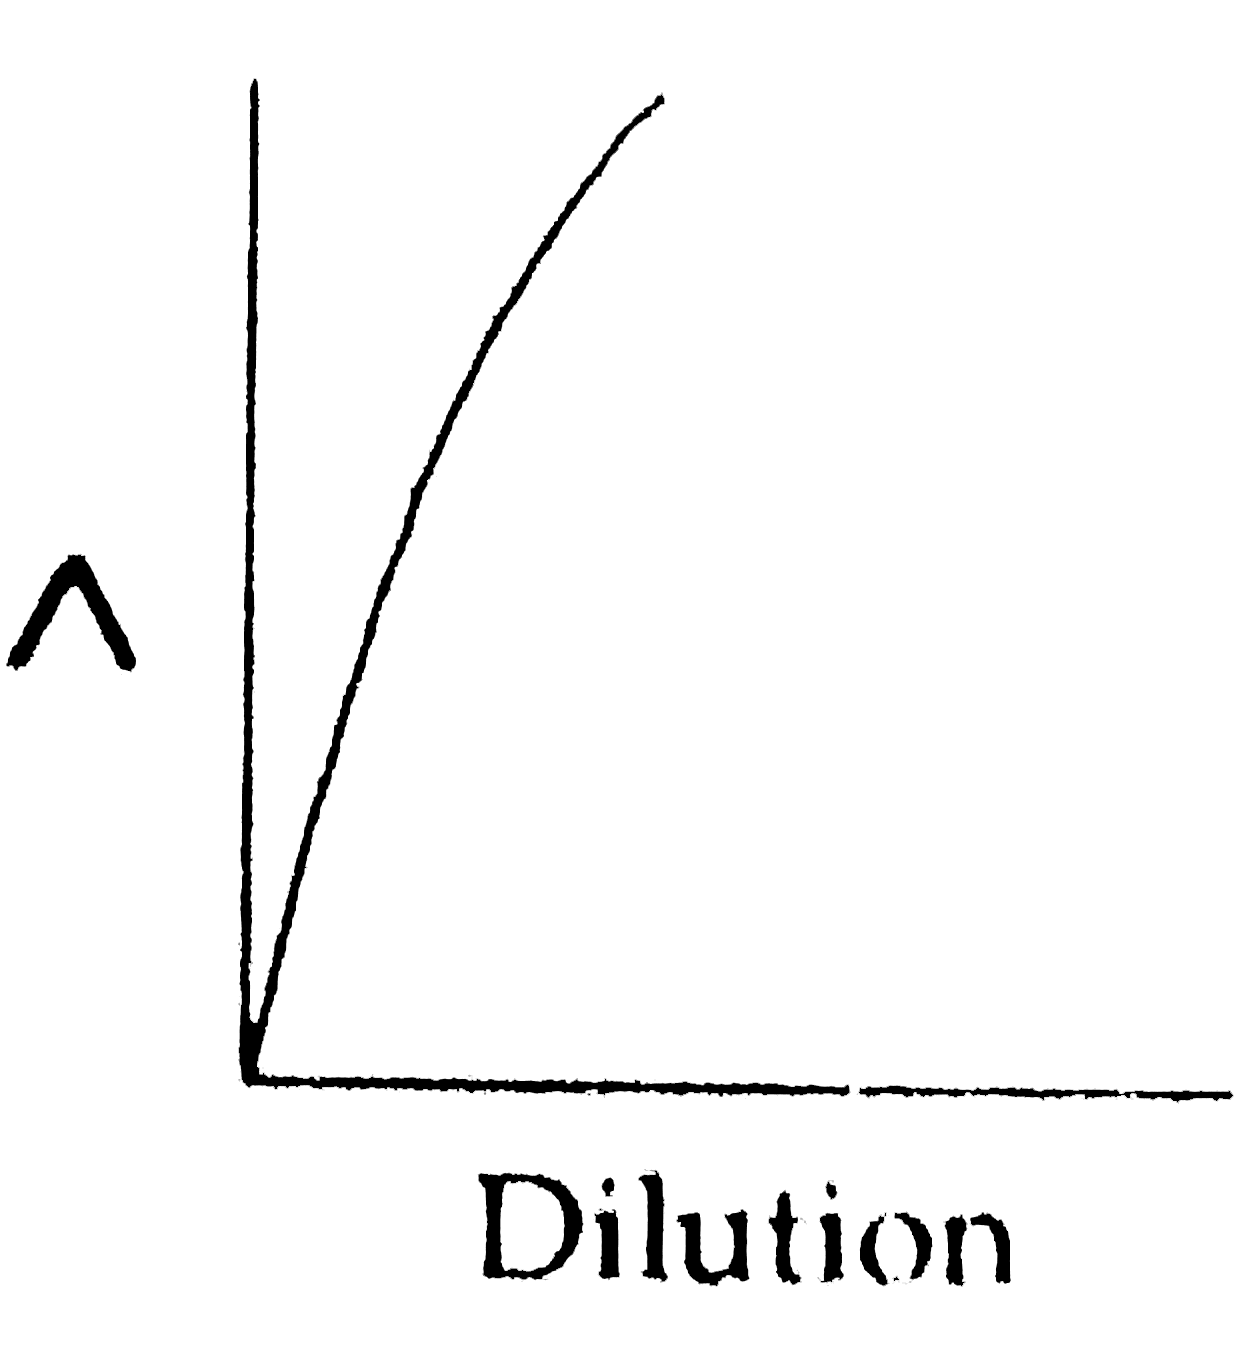 D
D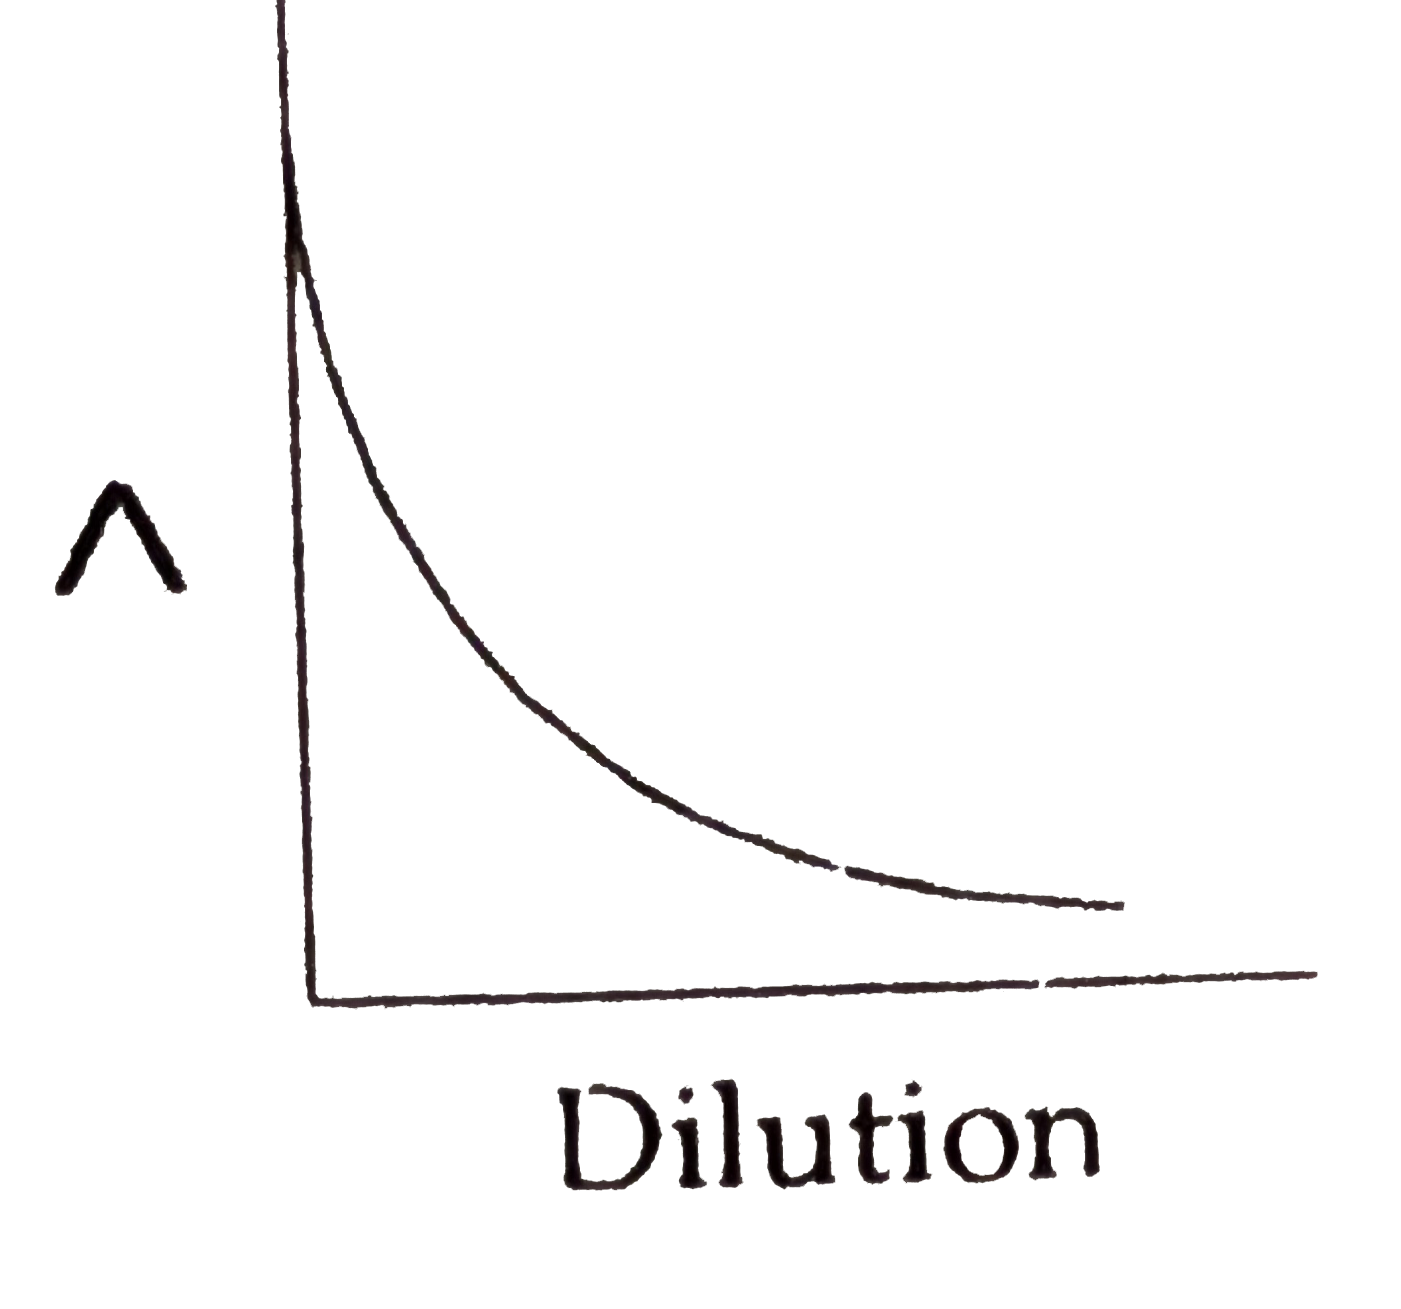
Which of the following plots represents correctly the variation of molar conductivity with dilution for a strong electrolyte?
A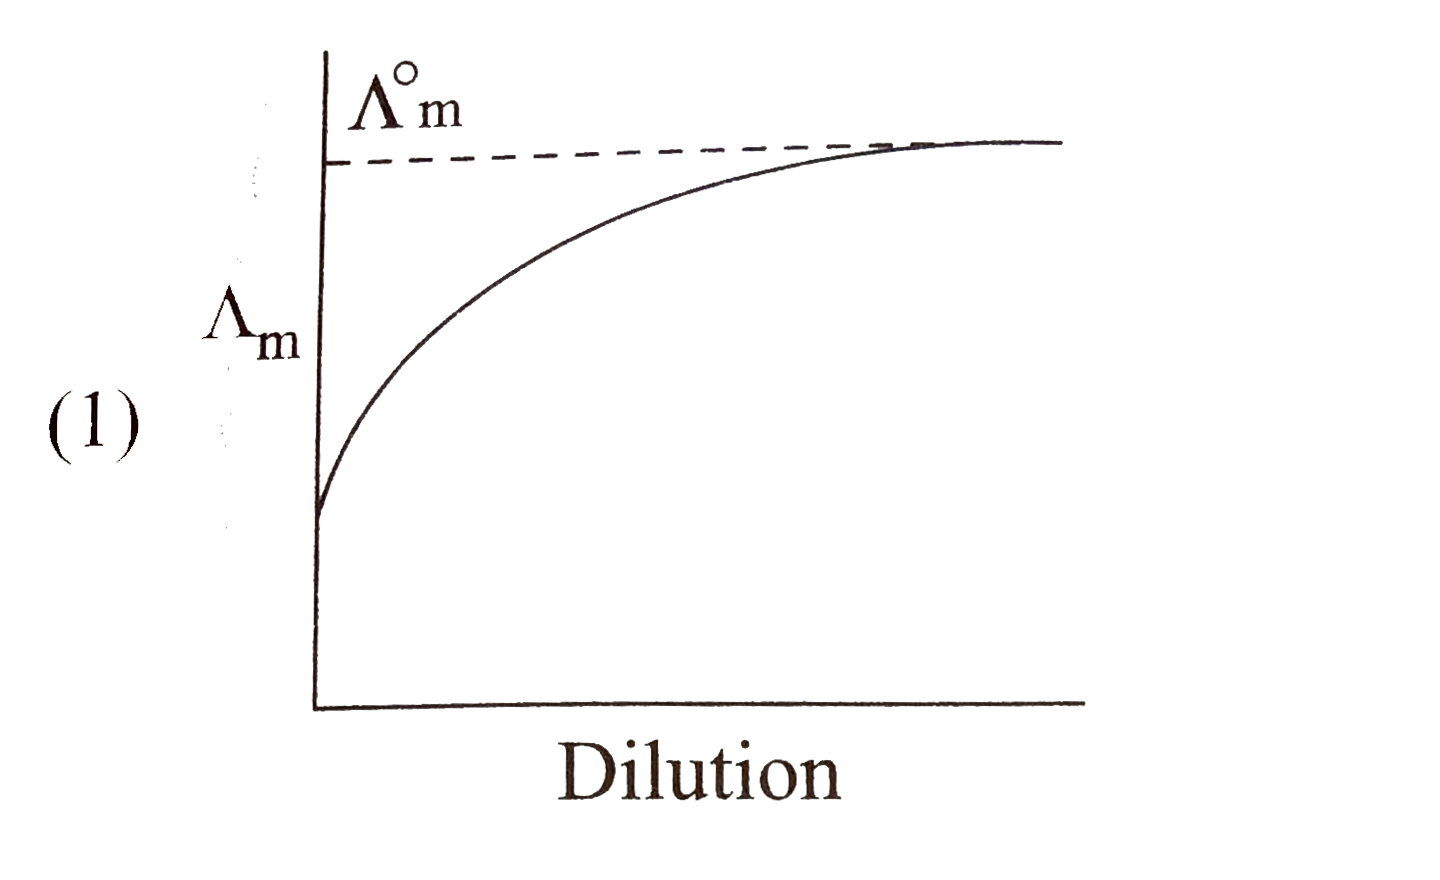 B
B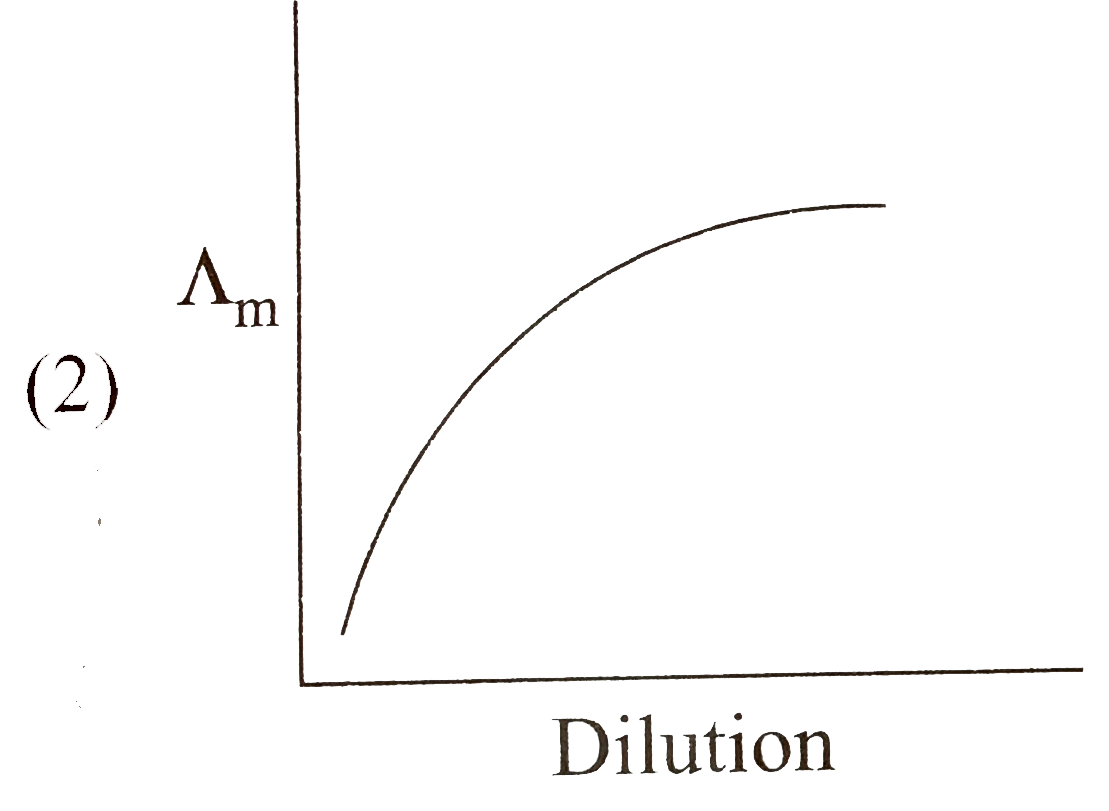 C
C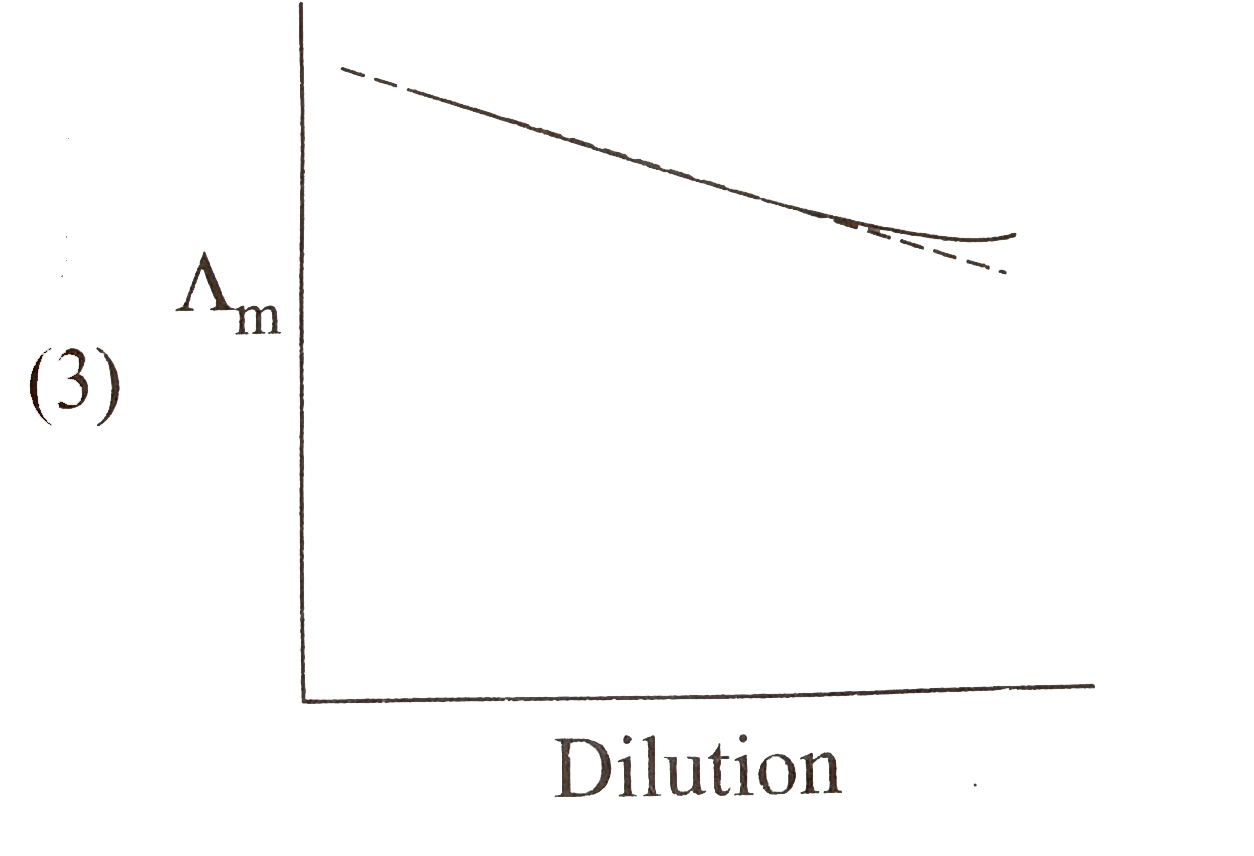 D
D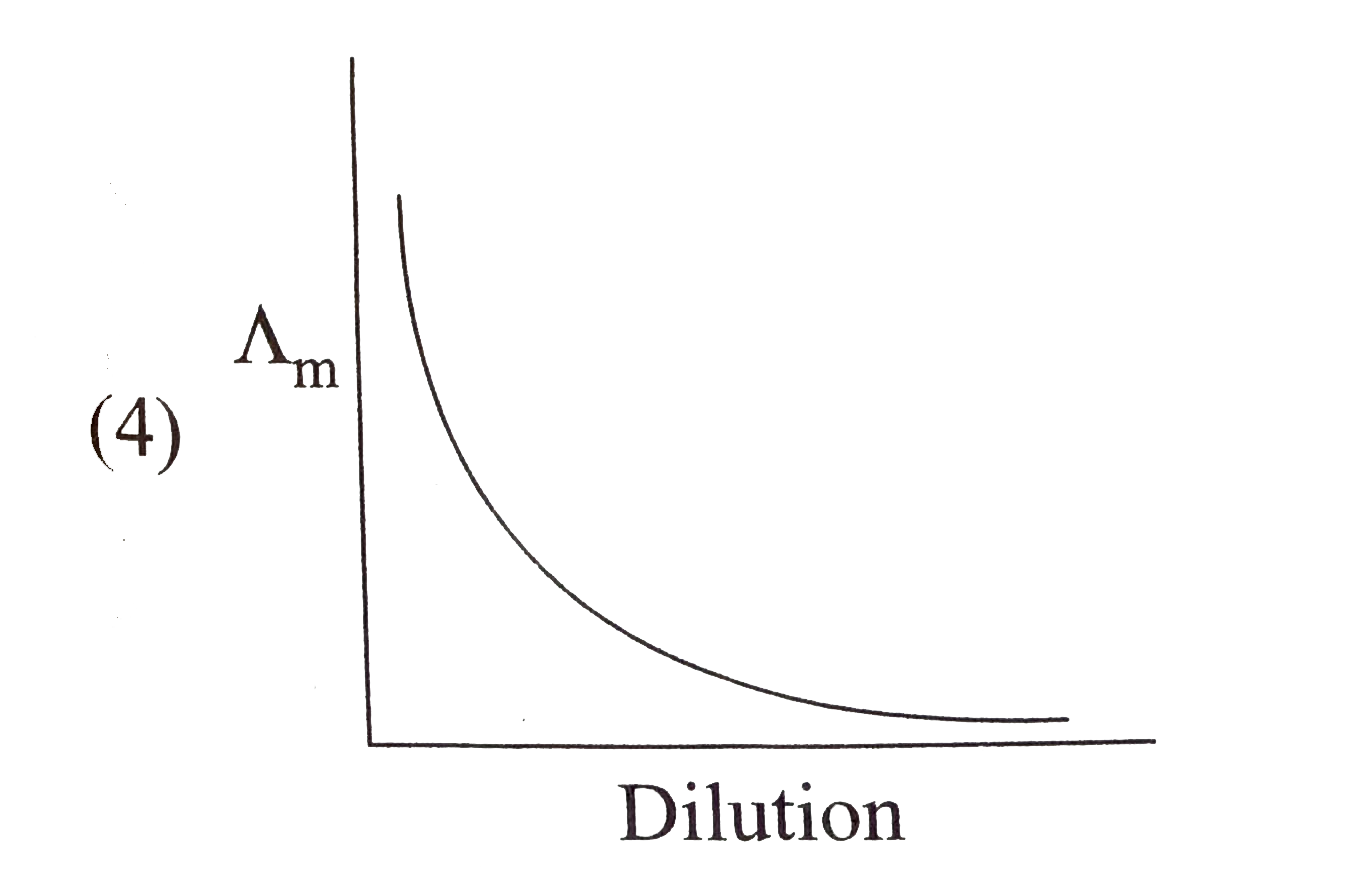
Which of the following plots correctly represents variation of equivalent conductance (∧eq) with dilution for a strong electrolyte ?
A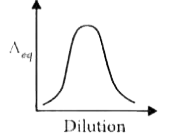 B
B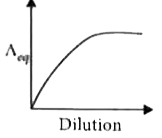 C
C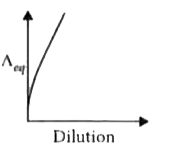 D
D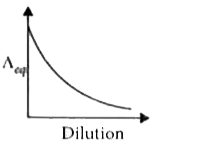
Which of the following plots represents correctly the variation of conductivity with concentration?
View SolutionWhich of the following graph correctly represents the variation of molar conductance (Δm) with dilution for a strong electrolyte ?
View SolutionWhat is the effect of dilution on the equivalent conductance of strong electrolyte
View SolutionThe variation of equivalent conductance versus concentration of a strong electrolyte is correctly given in the plot
View SolutionWhich of the following expressions correctly represents the equivalent conductance at infinite dilution of Al2(SO4)3. Given that Λ∘AI3+ and Λ∘SO2−4 are the equivalent conductances at infinite dilution of the respective ions?
View Solution
