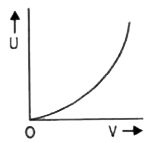
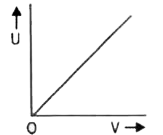
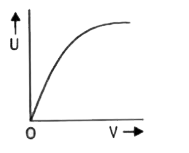
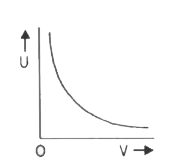
Which of the following graphs correctly represents the variation of heat energy (U) produced in a metallic conductor in a given time as a function of potential difference (V) across the conductor ?
A
B
C
D
Text Solution
The correct Answer is:A
Heat energy,U=V2Rt
U∝V2
|
Topper's Solved these Questions
- CURRENT ELECTRICITYBOOK - MODERN PUBLICATIONCHAPTER - CURRENT ELECTRICITYEXERCISE - MULTIPLE CHOICE QUESTIONS (LEVEL-III)
13 Videos
- ATOMS, MOLECULES AND NUCLEIBOOK - MODERN PUBLICATIONCHAPTER - ATOMS, MOLECULES AND NUCLEIEXERCISE - Recent Competitive Questions
40 Videos
- DESCRIPTION OF MOTION IN ONE DIMENSION BOOK - MODERN PUBLICATIONCHAPTER - DESCRIPTION OF MOTION IN ONE DIMENSION EXERCISE - Revision Test
45 Videos
Similar Questions
Knowledge Check
Which of the following I-V graph represents ohmic conductors?
A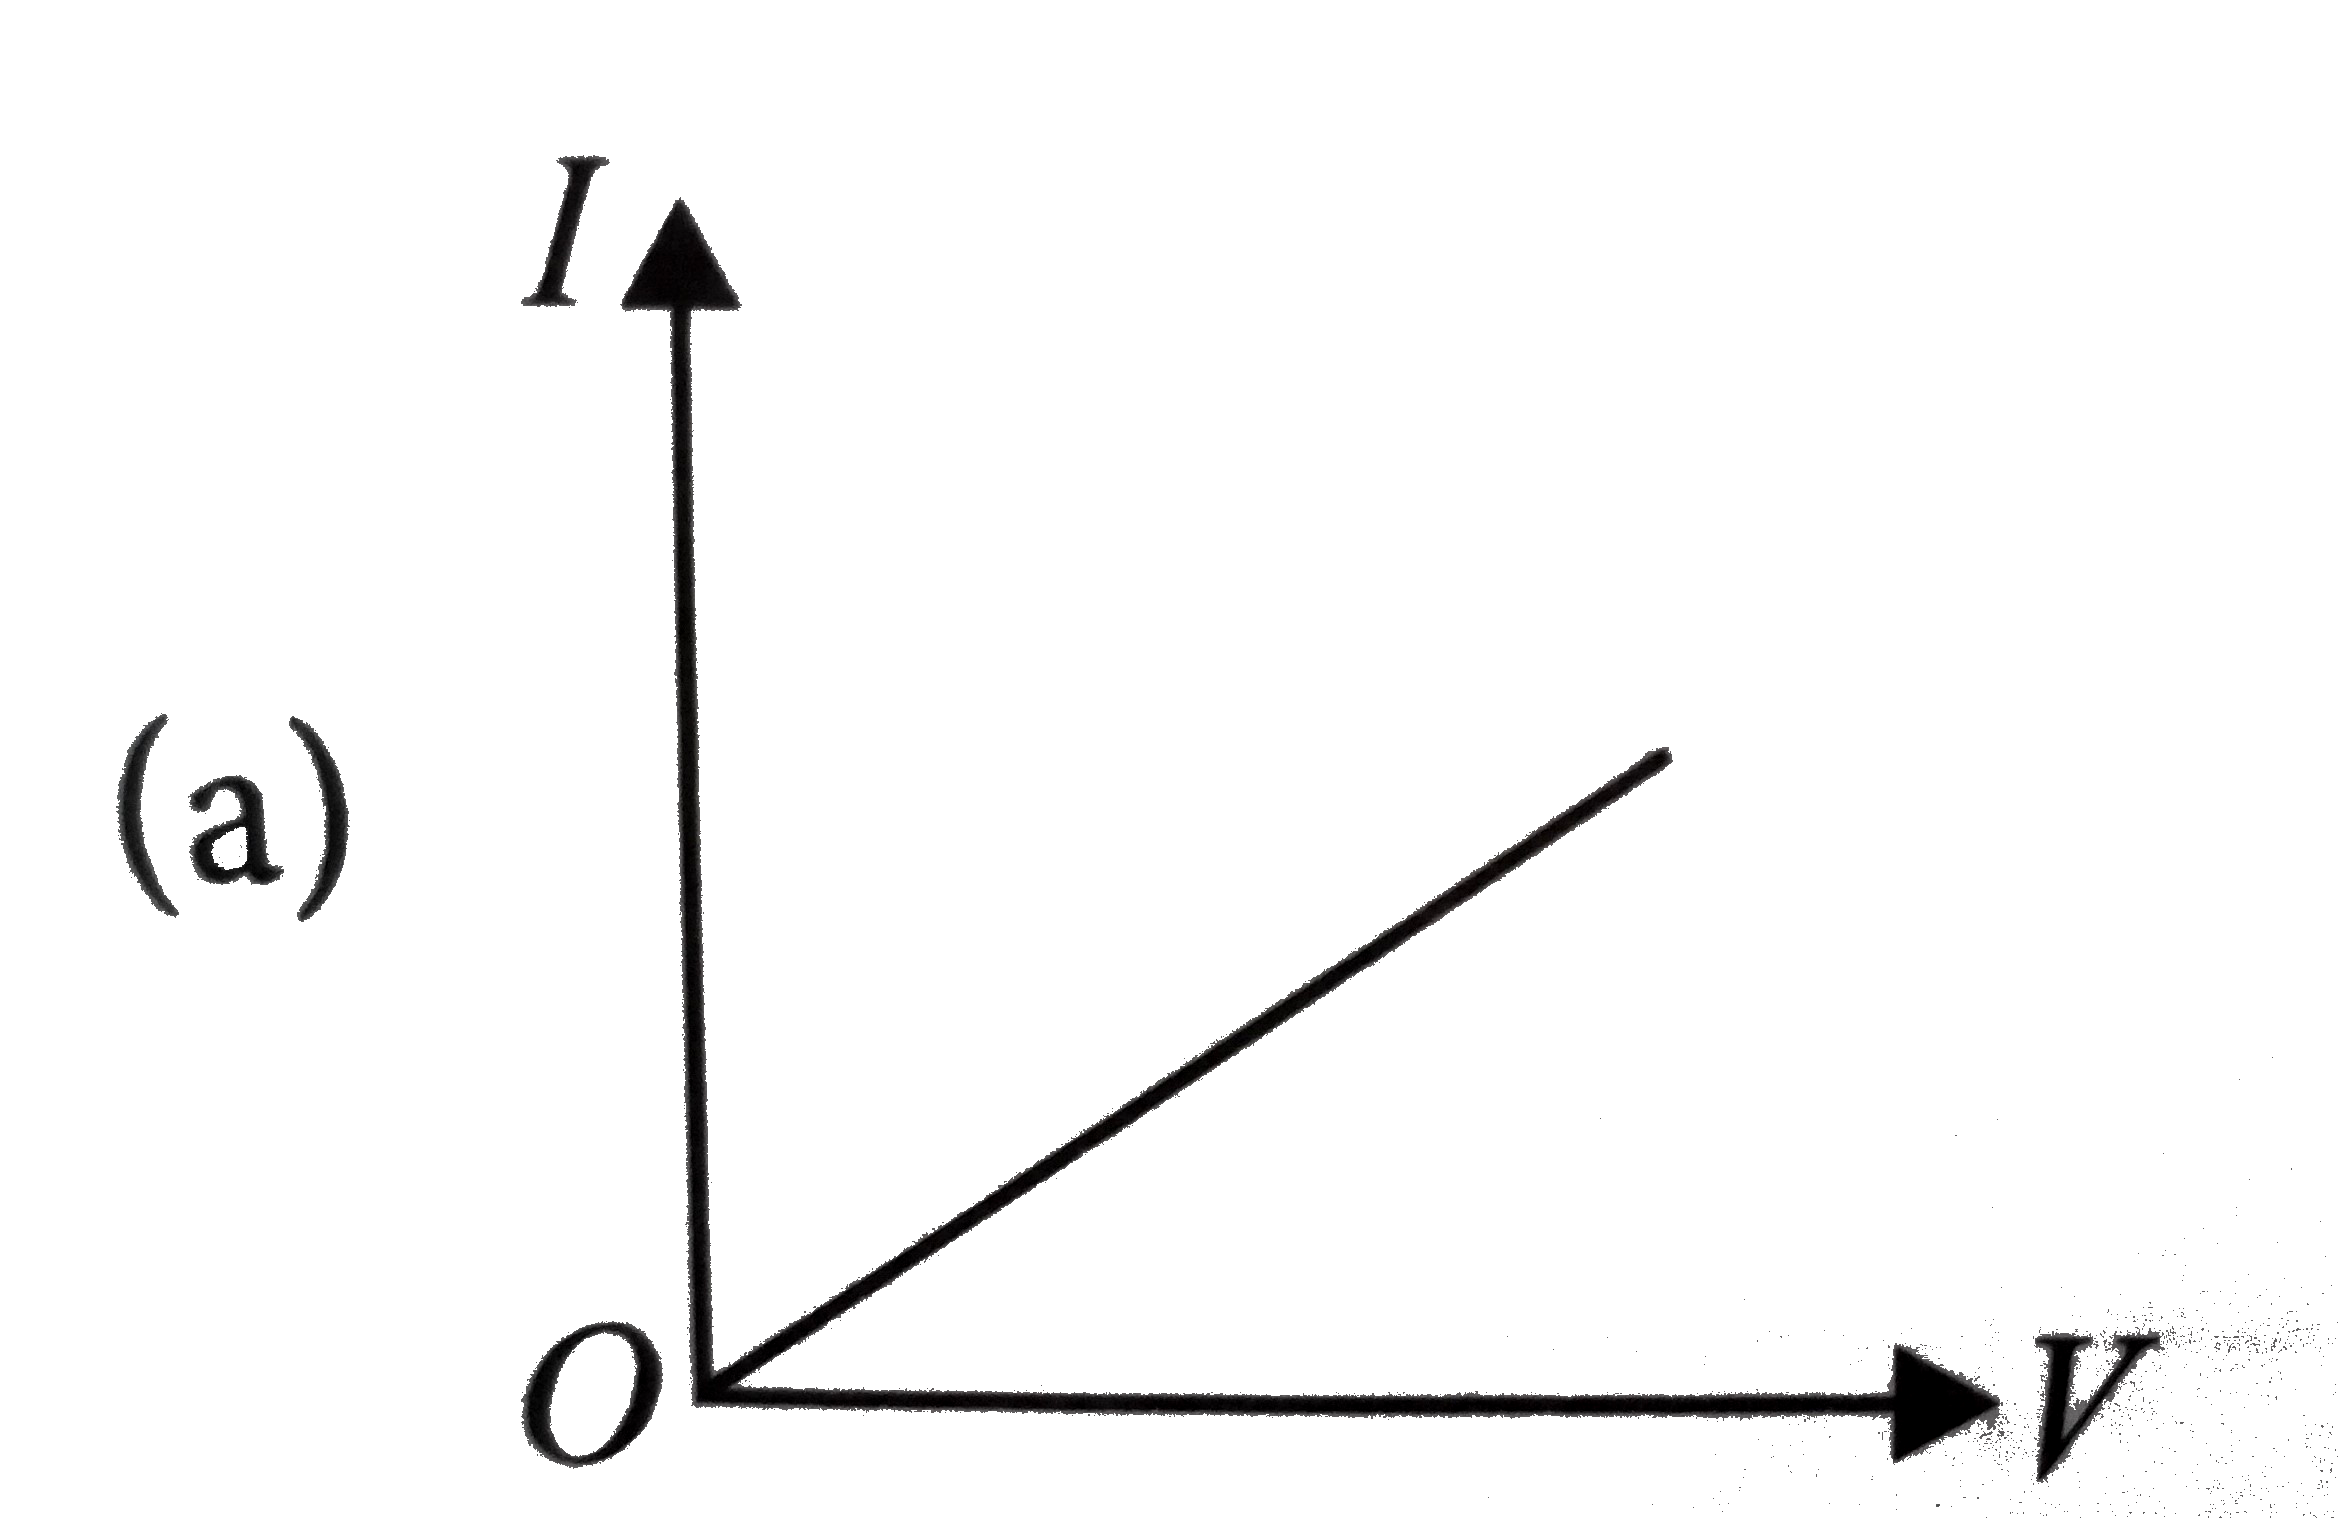 B
B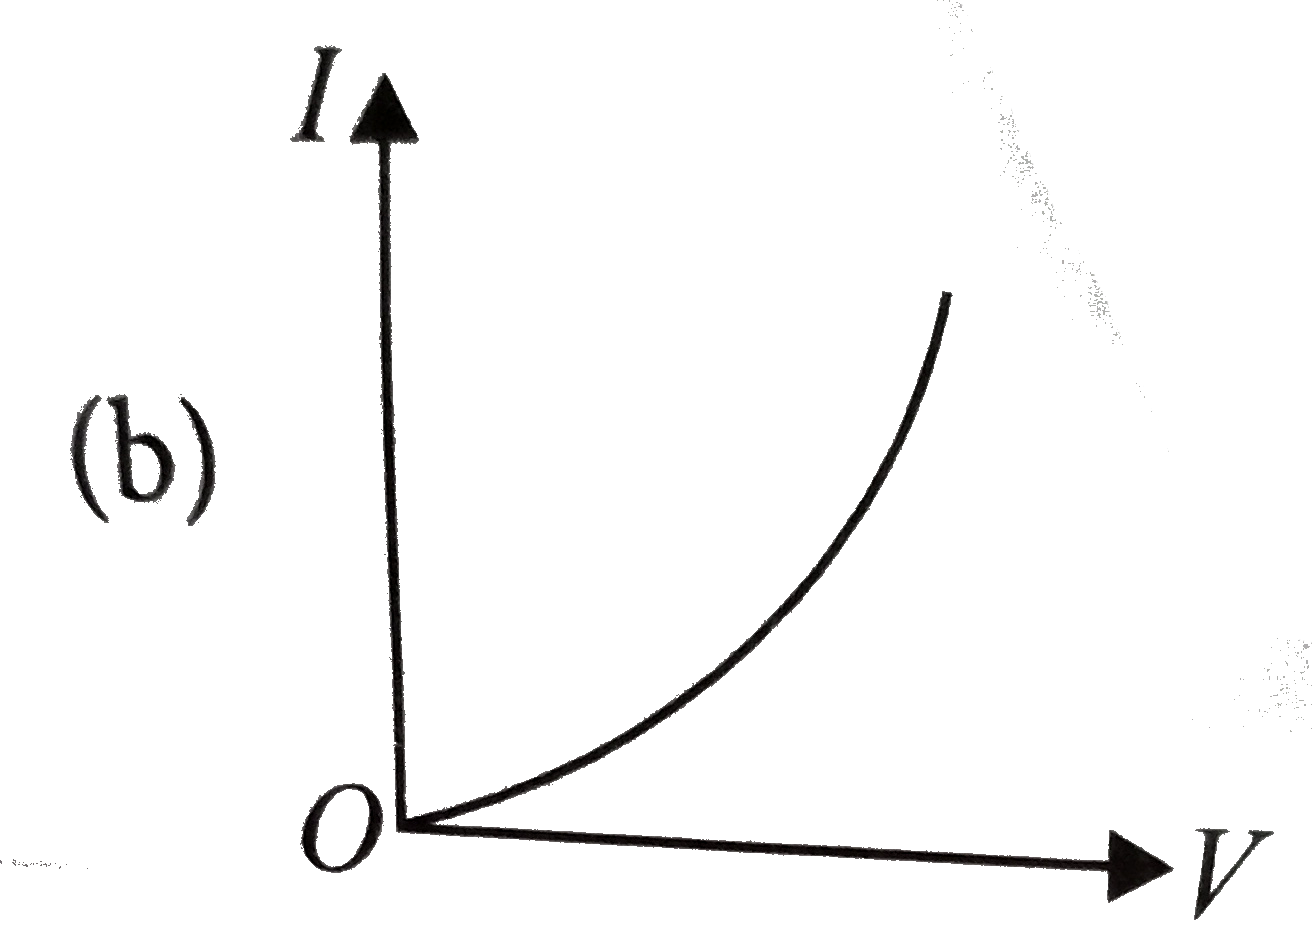 C
C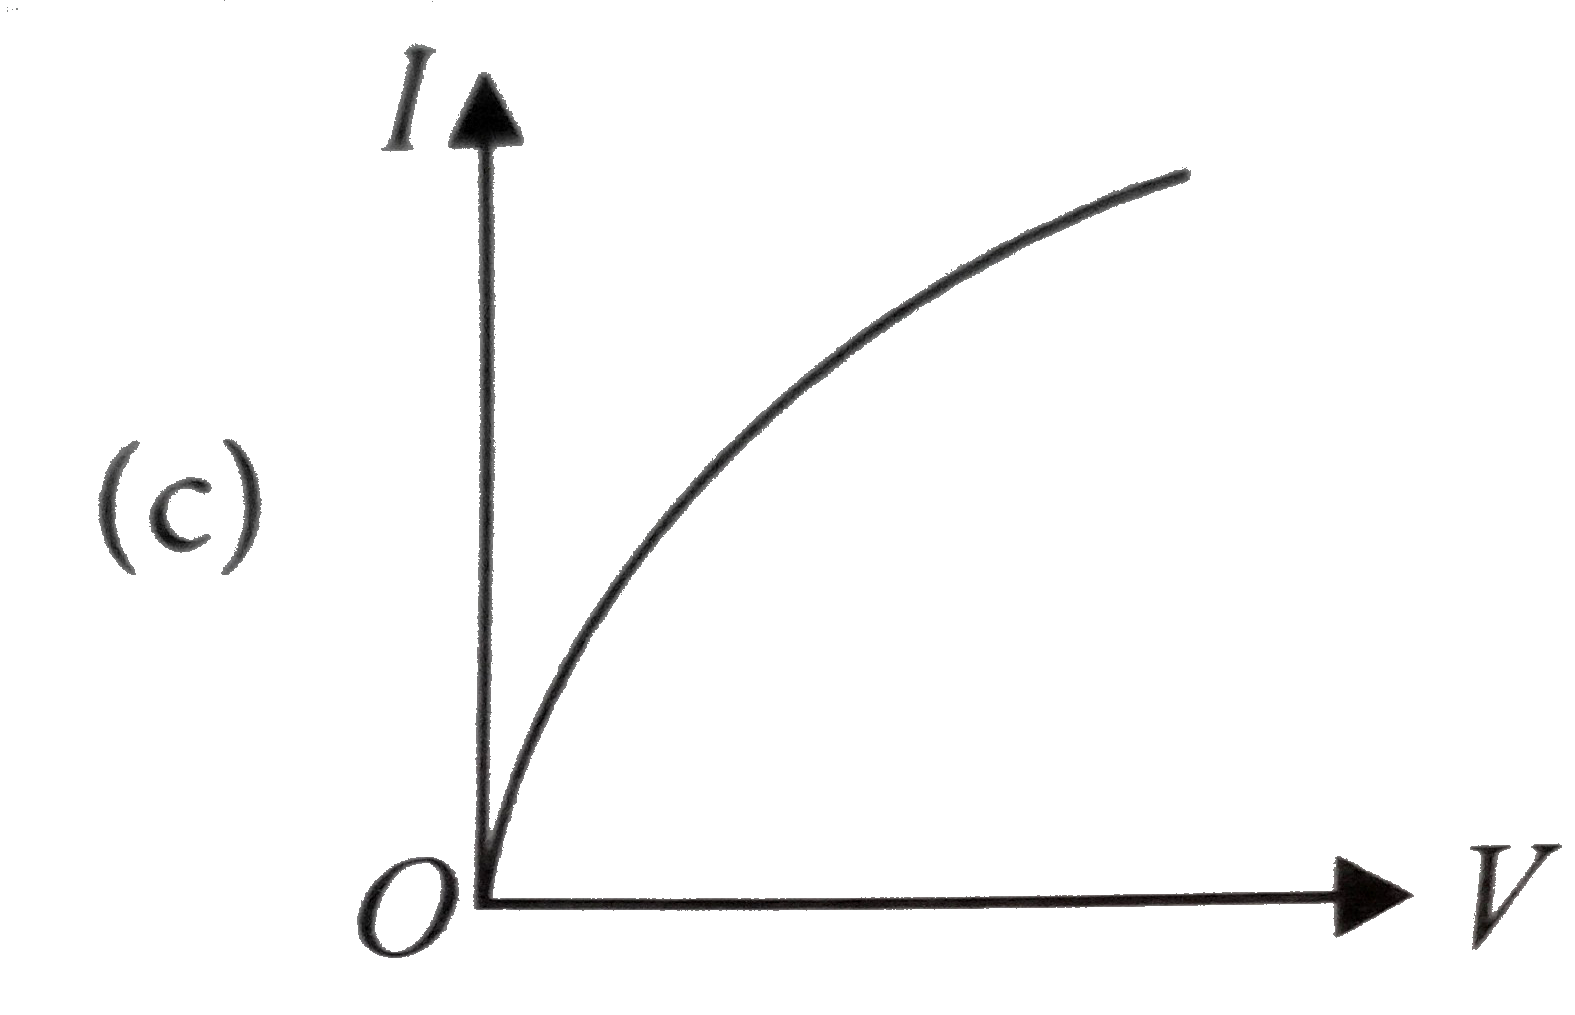 D
D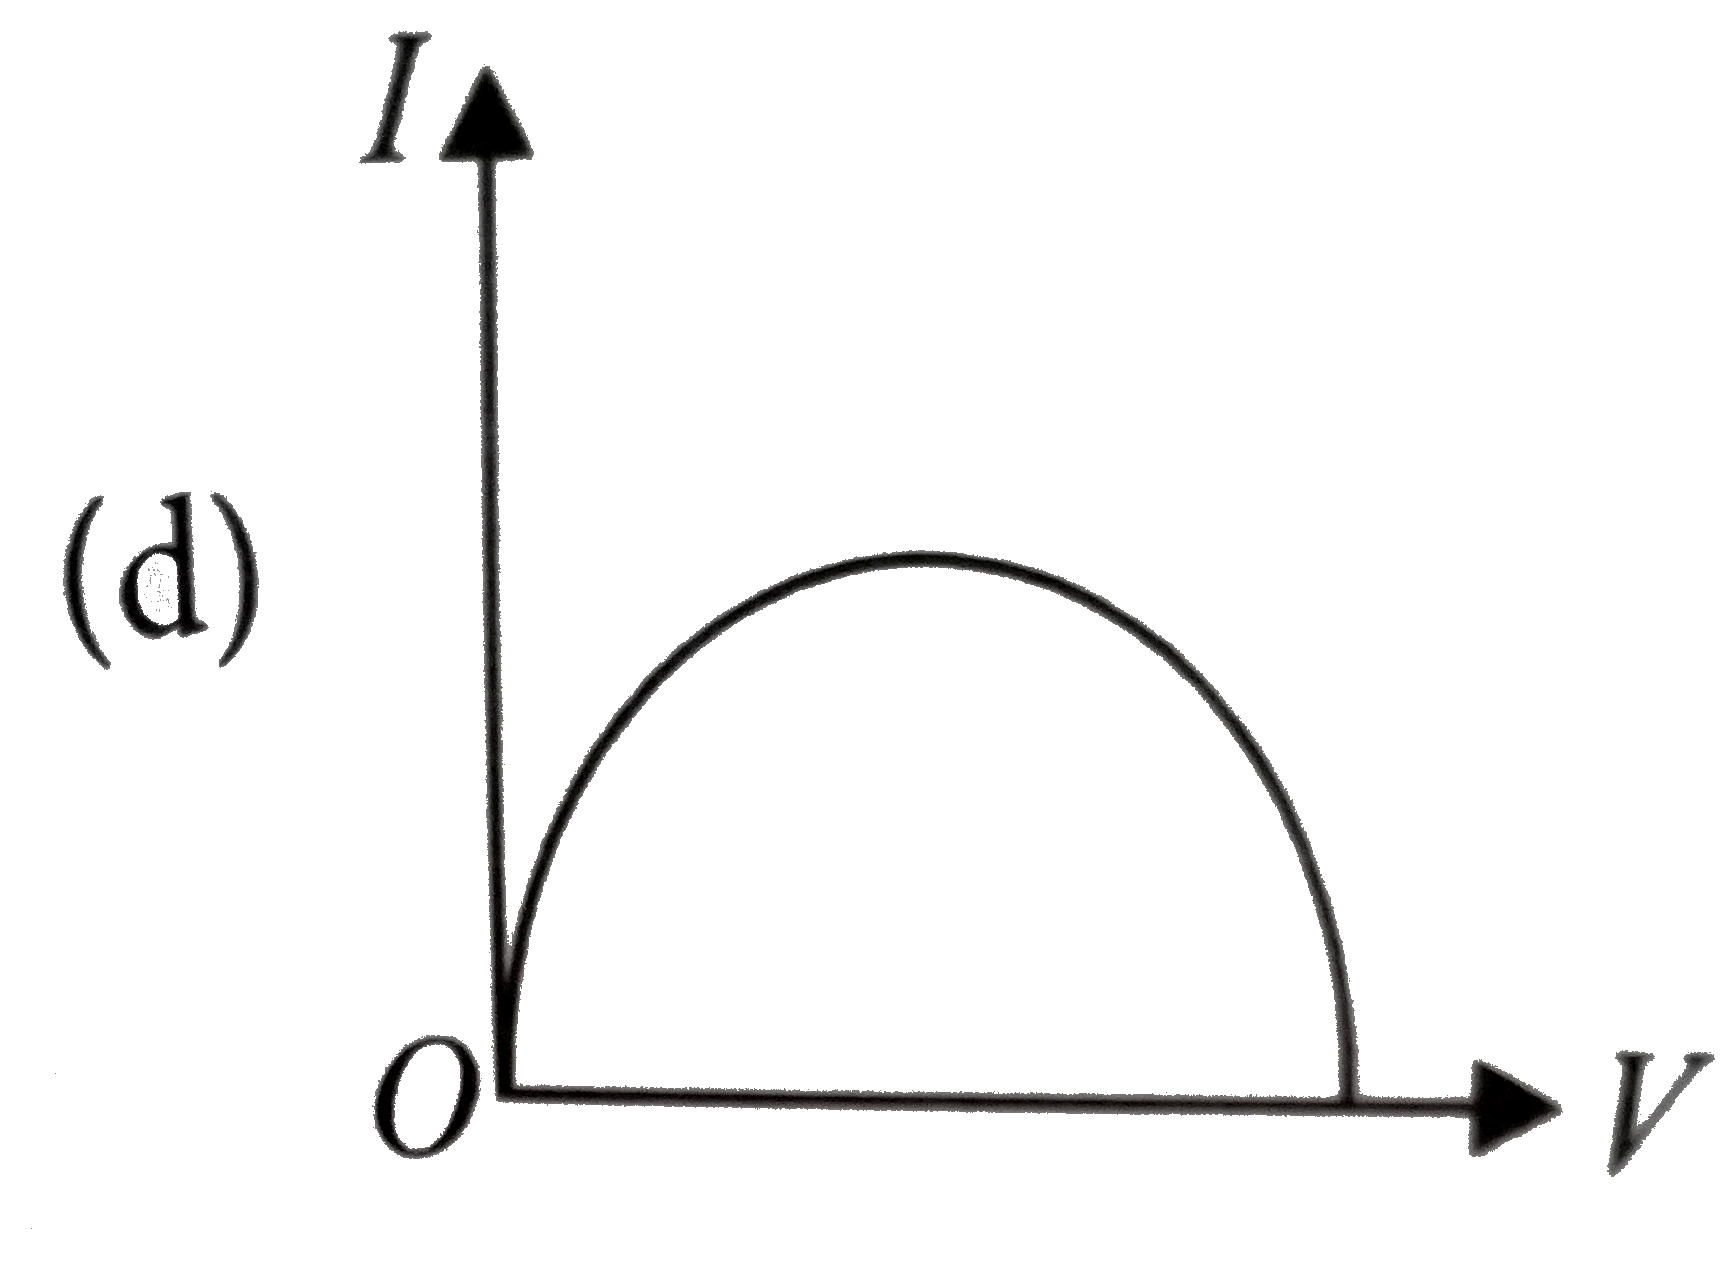
Which of the following I-V graph represents ohmic conductors?
A B
B C
C D
D
Across a metallic conductor of non-uniform cross-section a constant potential difference is applied. The quantity
ACurrent densityBCurrent flows form E to FCDrift velocityDElectric field
Which one of the following graphs represents the variation of maximum kinetic energy (EK) of the emitted electrons with frequency u in photoelectric effect correctly ?
View SolutionThe slope of the graph showing the variation of potential difference V on X-axis and current Y-axis gives conductor
View SolutionWrite the expression for the drift velocity of charge carriers in a conductor of length 'l' across which a potential difference 'V' is applied.
View SolutionThe slope of the graph showing the variation of potential difference V on X-axis and current Y-axis gives conductor
View SolutionWhen a potential difference is applied across the ends of a linear metallic conductor
View Solution
