The Table given below present the sunrise (SR) and sunset (SS) timings in a city during six consecutive days of a week. It is given that the total daylight time (in hrs) = T, and (12-T) expressed in hours is P.

On which day P is zero?
D4
D5
D2
D3
The correct Answer is:D
Step by step video, text & image solution for The Table given below present the sunrise (SR) and sunset (SS) timings in a city during six consecutive days of a week. It is given that the total daylight time (in hrs) = T, and (12-T) expressed in hours is P. On which day P is zero? by Maths experts to help you in doubts & scoring excellent marks in Class 14 exams.
Topper's Solved these Questions
- BOOK - SSC SELECTION POSTCHAPTER - SSC PREVIOUS YEAR PAPER GRADUATION LEVEL (17 JAN 2019 SHIFT 3)EXERCISE - Section: Graduation Level19videos
SSC PREVIOUS YEAR PAPER GRADUATION LEVEL (17 JAN 2019 SHIFT 3)
- BOOK - SSC SELECTION POSTCHAPTER - SSC PREVIOUS YEAR PAPER MATRIC LEVEL (14 NOV 2020 SHIFT 1)EXERCISE - Quantitative Aptitude25videos
SSC PREVIOUS YEAR PAPER MATRIC LEVEL (14 NOV 2020 SHIFT 1)
Similar Questions
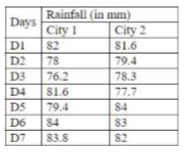
The Table given below presents the Rainfall (in mm) in two cities on different days of a week.
What is the difference (correct up to two decimal places) in average rainfall in two cities per day?
 View Solution
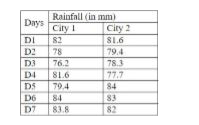
The Table given below presents the Rainfall (in mm) in two cities on different of a week.
The rainfall on day D2 in city 1 is how much percent more than the rainfall on day D4 in City 2?
 View Solution
Knowledge Check
- Question 1 - Select One
The Table given below present the sunrise (SR) and sunset (SS) timings in a city during six consecutive days of a week. It is given that the total daylight time (in hrs) = T, and (12-T) expressed in hours is P.
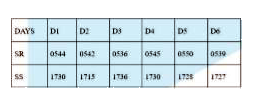
What is average of P for D3 to D6 (correct up to two decimal places)?A0.15B0.20C0.12D0.18 - Question 2 - Select One
The Table given below present the sunrise (SR) and sunset (SS) timings in a city during six consecutive days of a week. It is given that the total daylight time (in hrs) = T, and (12-T) expressed in hours is P.

If all P’s are represented through a pie chart, what will be the central angle (in degrees) of the sector representing D2?A96B108C126D135 - Question 3 - Select One
The Bar graph given below presents the number of female employees working in two factories on six different days of a week.
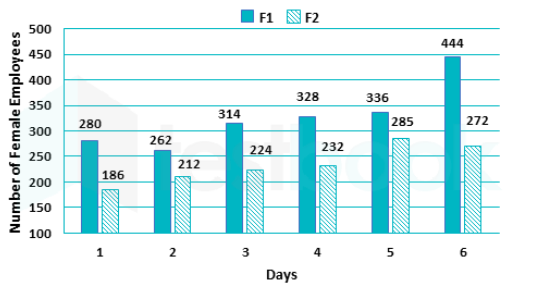
On which day the number of female workers in the factories Fl and F2, taken together, is the second highest?AA) D3BB) D6CC) D5DD) D4
The Table given below presents the Rainfall (in mm) in two cities on different days of a week.
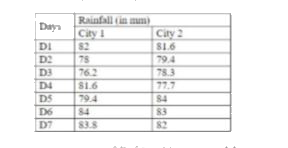
If the data of Rainfall of city 1 is represented through a Pie chart, then what will be the central angle (nearest to 0.1 degree) corresponding to D1?View SolutionStudy the data given below and answer the following question. The pie charts shown below shows the distance covered by a boat moving upstream and downstream in different days of a week. And the table shows the speed of stream in km/hr. in different days of a week.
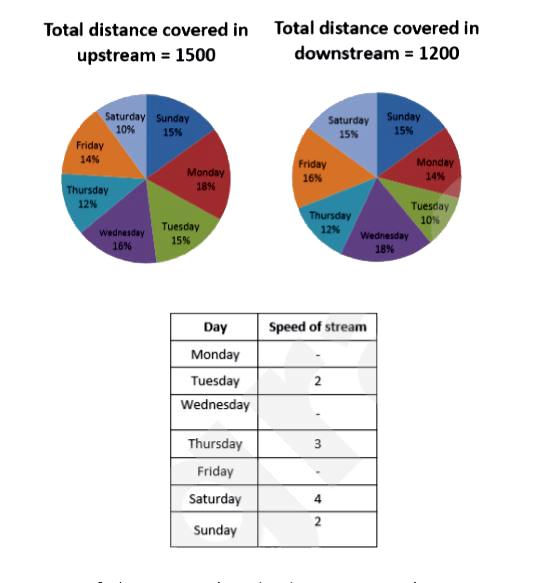
If the speed of boat in still water on Friday was 22 km/hr and the speed of boat in still water on Tuesday was 10/11 times of Friday and time taken to travel downstream on Friday is 20/11 hrs more than the time taken by it to travel downstream on Tuesday, then find the speed of stream (in kmph) on Friday?View SolutionThe table given below shows the temperatures recorded on a day at different times.
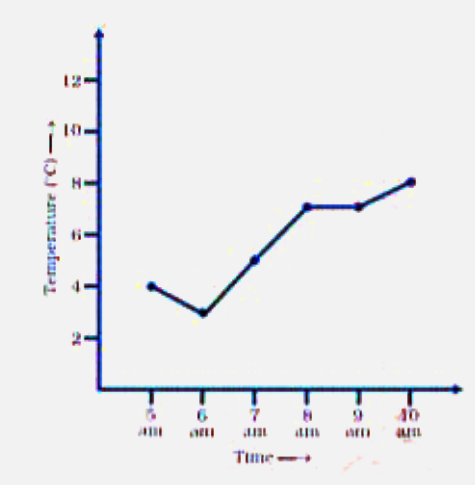
Observe the table and answer the following questions.
(a) What is the temperature at 8 am?
(b) At what time is the temperature 3∘C?
(c) During which hour did the temperature fall?
(d) What is the change in temperature between 7 am and 10 am?
(e) During which hour was there a constant temperature?View SolutionThe table below represents the distance (in km) travelled by six trucks on six different days of the week. Read the table and answer the questions based on it.
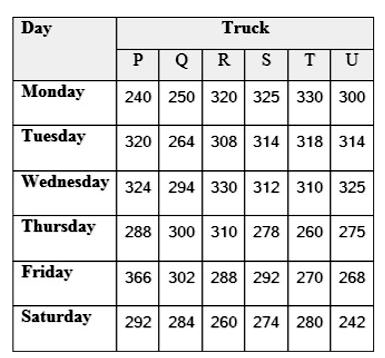
If to travel the given distance, the time taken by Truck Q on Friday was 8 hours, then what was its average speed on that day ?
A. 37.5 km/hr
B. 42.50 km/hr
C. 28.25 km/hr
D. 32.25 km/hrView SolutionA survey of film watching habits of people living in five cities P, Q, R, S and T is summarised below in a table. The column I in five table gives percentage of film-watchers in each city who see only one film a week. The column II gives the total number of film-watchers who see two or more films per week.
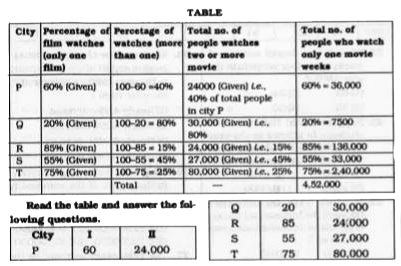
Which city has the highest number of film watchers who see only one film in a week?View Solution

