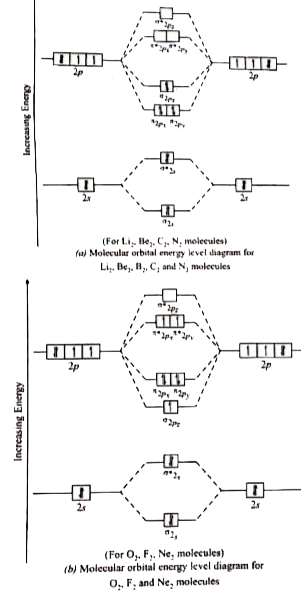
Draw the energy level diagrams indicating the energy of the molecular orbitals .
Similar Questions
Energy Level Diagram For Mo
View SolutionThe ionisation potential of hydrogen atom is 13.6 eV. Draw the energy level diagram showing four levels. Calculate :
(i) The energy of the photon emitted, when an electron falls from the third orbit to the second orbit.
(ii) The wavelength of this photon.
View SolutionDraw molecular orbital energy level diagram for nitrogen molecule.
View SolutionWhat do you understand by an energy level diagram? Show the molecular orbitals formed by overlapping of 1s-, 2s- and 2p-atomic orbitals on an energy level diagram.
View SolutionDraw the energy-level diagram of hydrogen atom. Show the Lyman series and Pfund series in the diagram.
View SolutionDraw energy level diagram for hydrogen atom and show the various line spectra originating due to transition between energy levels.
View SolutionDraw a neat labelled energy level diagram for H-atom showing the transitions.
View SolutionDraw a neat, labelled energy level diagram for H atom showing the transitions.
Explain the series of spectral lines for H atom. Whose fixed inner orbit numbers are 3 and 4 respectively.
The work function for potassium and caesiumare 2.25 eV and 2.14 eV respectively. Is the photoelectric effect possible for either of them if incident wavelength is 5180 Å ?
[Given : Planck's constant =6.63×10⁻³⁴J.s., Velocity of light =3×10⁸m/s,1eV=1.6×10−19J]
View SolutionDraw energy level diagram for Balmer series for transition between eriergy levels.
View SolutionDraw energy level diagram for Hydrogen atom showing at least four lowest energy levels. Show the transitions responsible for emission of Balmer series.
View Solution

