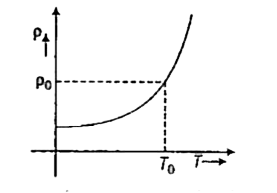
Plot resistivity (specific resistance) of a metal as a function of temperature (K).
Text Solution
Resisitvity of a metal as a function of temperature is shown as a below .

|
Similar Questions
Knowledge Check
The specific resistance of all metals is most affected by
ATemperatureBPressureCDegree of illuminationDApplied magnetic fieldThe resistance of a metallic conductor increases with temperature due to.
Achange in carrier densityBchange in the dimensions of the carriersCincrease in the number of collisions among the carriersDincrease in the rate of collision between the carriers and the vibrating atoms of the conductor.
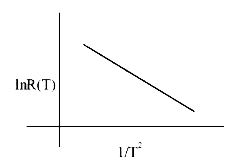
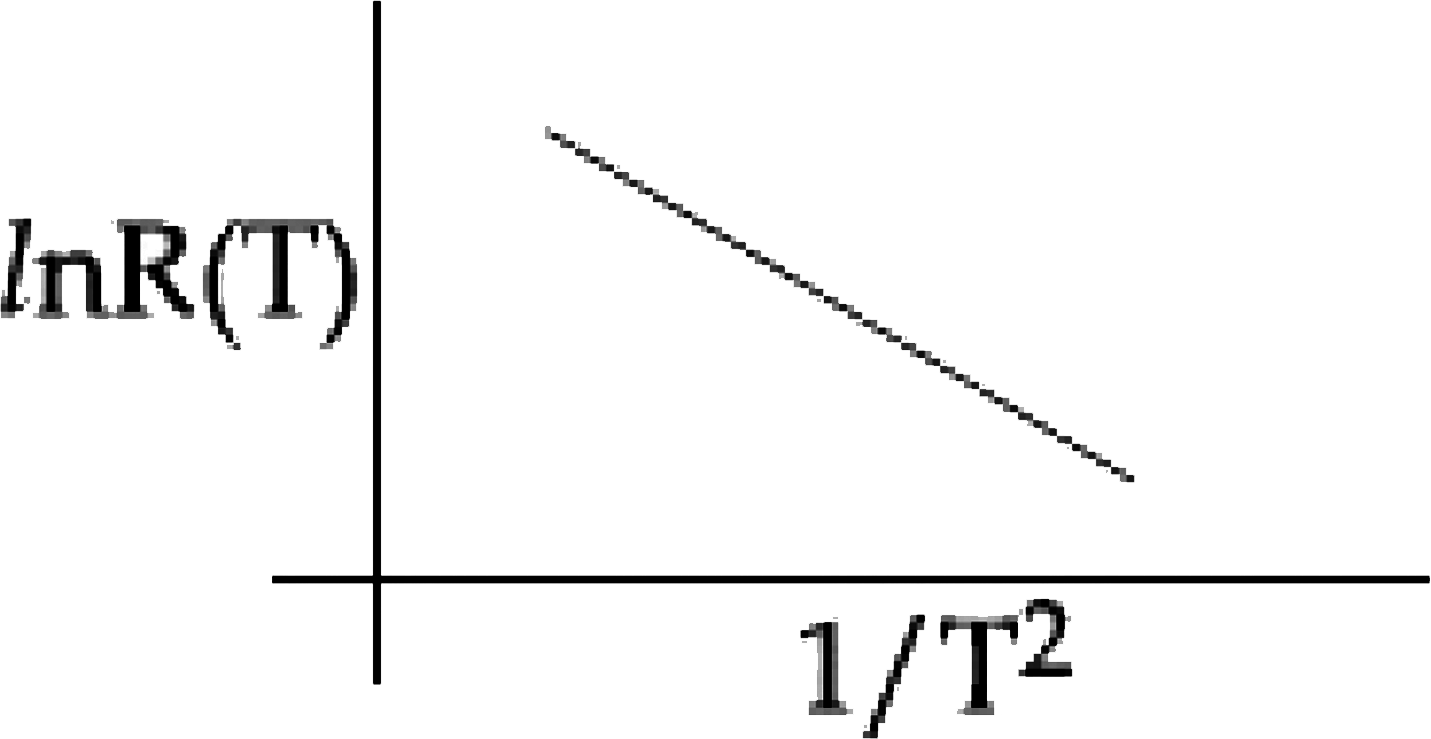
In an experiment, the resistance of a material is plotted as a function of temperature (in some range). As shown in the figure, it is a straight line. One may conclude that:

View SolutionDraw a graph to show the variation of resistance of a metal wire as a function of its diameter, keeping length and temperature constant.
View SolutionSpecific Resistance or Resistivity
View SolutionThe resistance of a metallic conductor increases with temperature due to.
View SolutionShow variation of resistivity of copper as a function of temperature in a graph.
View SolutionShow variation of resistivity of copper as a function of temperature in a graph.
View Solution

