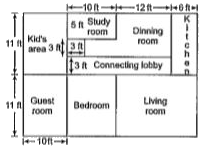
Class VI students were given the following layout of a house.

The students were asked to find out the
A. perimeter and area of each room.
B. total perimeter and total area of the house.
The above activity can be used by teacher as formative assessment task because
the students will find the task interesting and will not disturb each other
it will remove the phobia of Maths examination
it will be easy for teacher to engage all the students for 40 min period
the students' responses will help teacher to diagnose their understanding regarding finding dimensions, calculations knowledge of formulae for perimeter and area etc.
The correct Answer is:B
Topper's Solved these Questions
Similar Questions
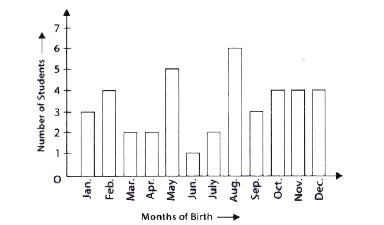
In a particular section of Class IX, 40 students were asked about the months of their birth and the following graph was prepared for the data so obtained:

Observe the bar graph given above and answer the following question: Find the probability that a student of the class was born in August.
View SolutionClass XI students of a school wanted to give a farewell party to the outgoing students of class XII. They decided to purchase two kinds of sweets, one costing 250 per kg and the other costing 350 per kg. They estimated that 40 kg of sweets were needed. If the total budget for the sweets was 11,800, find how much sweets of each kind were bought?
View Solution
Knowledge Check
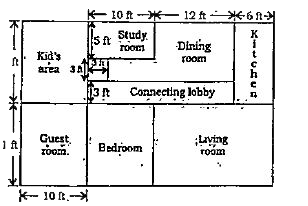
Class ' VIh students' were given -the following layout of a house :

The students were asked to find out the
(1) Perimeter and area of each room.
(2) Total perimeter and total area of the house.
The above activity can be used by teacher as forinative assessment task becauseAIt will be easy for teacher to engage all the student for 40 minutes periodBThe students responses will help teacher to diagnose their understanding regarding, knowledge of formulae for perimeter and area, etc.CThe students will find the task interesting and will not disturb cach otherDIt will remove the pliobia of Maths examinationA teacher of class V asks her students to perform a survey in their area to find out how much water is used in each house and present a report. Which process skills can be assessed through this activity ?
A(a) Experimentation, prediction,, observationB(b) Experimentation, observation, classificationC(c)Observation, hypothesising, measurementD(d)Communication, questioning, InferenclngWhile teaching the topic on Air is every where a teacher asks the following questions from the students
A. Is there are in the soil ?
B. Is there air inside water ?
C. Is there air inside our body ?
D. Is there air inside out house ?
Which one of the following skill is the teacher trying to develop in the learners ?AClassification skillBThniking skillCEmotional skillDObservation skill
There were 80 persons in a trip organised by a school. Out of which 60 were students, 14 were teachers and 6 (all males) were peons. Out of total persons, 16 were females including one lady teacher. Present the above information in a table.
View SolutionWhich of the following statements are true or false?
(a) Geeta wants to raise a boundary wall around her house. For this, she must find the area of the land of her house.
(b) A person preparing a track to conduct sports must find the perimeter of the sports ground.
View SolutionTotal number of students of a school in different years is shown in the following table: Year, No. of Students 1996 1998 2000 2002 2004, 400 550 450 600 650 Represent the above data by a pictograph. Prepare a pictograph of students using one symbol an icon of a student to represent 100 students and answer the following questions: How many symbols represent total number of students in the year 2002? How many symbols represent total number of students in the year 1998? Prepare another pictograph of students using any other symbol each representing 50 students. Which pictograph do you find more informative?
View SolutionTotal number of students of a school in different years is shown in the following table: Year, No. of Students 1996 1998 2000 2002 2004, 400 550 450 600 650 Represent the above data by a pictograph. Prepare a pictograph of students using one symbol an icon of a student to represent 100 students and answer the following questions: How many symbols represent total number of students in the year 2002? How many symbols represent total number of students in the year 1998? Prepare another pictograph of students using any other symbol each representing 50 students. Which pictograph do you find more informative?
View SolutionIn a class of 40 students and 5 teachers, each student got sweets that are 15% of the total number of students and each teacher got sweets that are 20% of the total number of students.How many sweets were there?
View Solution
