Study the following graph carefully to answer the questions.
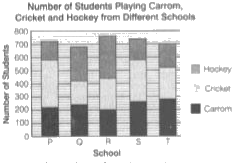
If out of the students playing Cricket from schools Q,S and T 40%, 35% and 45% respectively got selected for state level competition what was the total number of students got selected for State level competition frm these three schools together ?
346
241
292
284
The correct Answer is:C
Step by step video, text & image solution for Study the following graph carefully to answer the questions. If out of the students playing Cricket from schools Q,S and T 40%, 35% and 45% respectively got selected for state level competition what was the total number of students got selected for State level competition frm these three schools together ? by Maths experts to help you in doubts & scoring excellent marks in Class 14 exams.
Similar Questions
Study the following graph carefully and answer the questions that follow
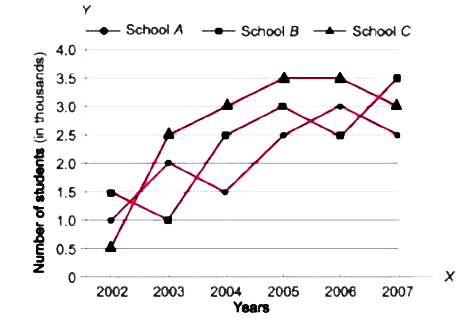
What was the average number of students in all schools together in the year 2006 ?View SolutionStudy the following graph carefully to answer the questions.
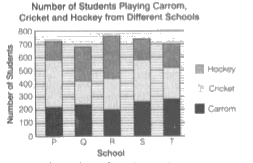
Total number of students playing Hockey from all schools together is approximately what per cent of the total number of students playing Cricket from all schools together ?View Solution
Knowledge Check
- Question 1 - Select One
Study the following graph carefully to answer the questions.
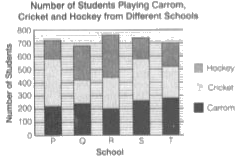
From school P, out of the students playing Carrom, 40% got selected for State level competition. Out of which 25% further got selected for National level competition. From school T, out of the students playing Carrom, 45% got selected for State level competition , out of which two- third further got selected for National level competition . What is the total number of students playing carrom from these two schools who got selected for National level competition ?A106B98C112D108 - Question 2 - Select One
Study the following graph carefully to answer the questions that follow-----
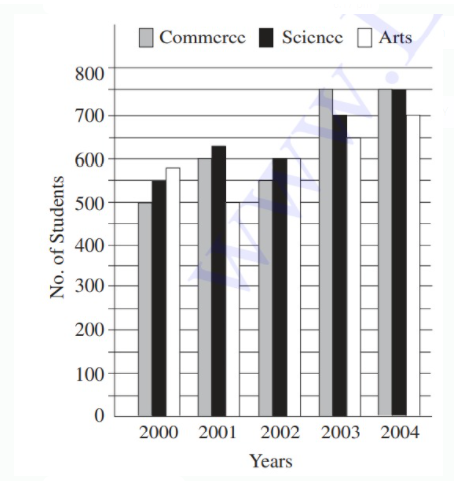
What is the total number of students studying Arts in all the years together ?A3700B2750C3500DNone of these - Question 3 - Select One
Study the following graph carefully to answer the questions.
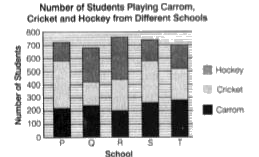
Total number of students playing Carrom and Hockey together from school P is what per cent of the total number of students playing these two games together from school R ?A68316B62313C69313D63313
Read the following table carefully and answer the questions given below.

If number of appeared students from school B and F in 1998 and 2000 are 4000 and 5000 respectively, what is thte total number of passed students from school B and F in the same years?View SolutionStudy the following graph carefully to answer the questions.
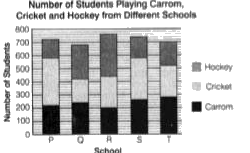
If the number of students playing each game in school S in increased by 15% and the number of students playing each game in school Q is decreased by 5% then what will be the difference between number of students in school S and Q?View SolutionStudy the following graph carefully and answer the questions that follow
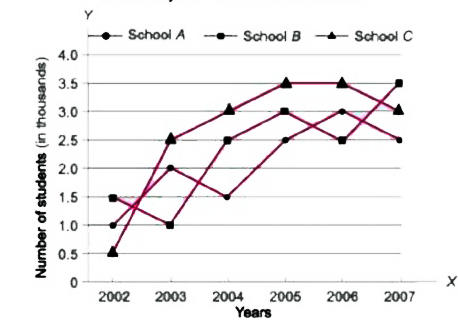
What was the approximate average number of students in school A over all the years together ?View SolutionStudy the following table and answer the questions.

Which school has the highest number of students scoring exactly 50% marks ?View SolutionStudy the following graph carefully and answer the questions that follow
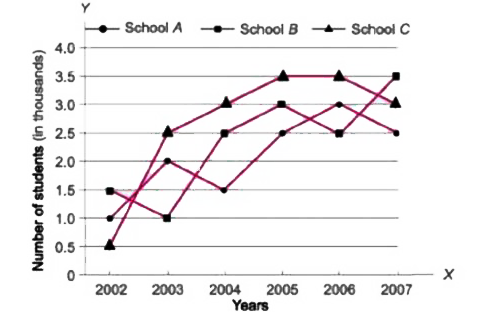
How many times the total number of students in all the three schools A,B and C together was exactly equal among the given years ?View Solution

