Answer the questions based on the information given below:
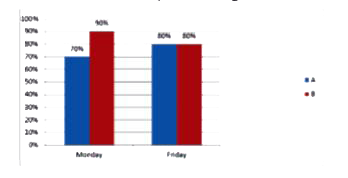
Two person A and B work in a call center. They receive calls of which they execute some percentage. Below bar graph shows the percentage of calls executed by them on 2 days i.e. Monday and Friday. Based on the following graph, answer the questions given below:

If B executes 200 calls on Friday and he received 25% more calls than A on Friday. Then A executed what number of calls on Friday?
A)160
B)80
C)125
D)200
Step by step video & image solution for Answer the questions based on the information given below: Two person A and B work in a call center. They receive calls of which they execute some percentage. Below bar graph shows the percentage of calls executed by them on 2 days i.e. Monday and Friday. Based on the following graph, answer the questions given below: If B executes 200 calls on Friday and he received 25% more calls than A on Friday. Then A executed what number of calls on Friday? by Maths experts to help you in doubts & scoring excellent marks in Class 14 exams.
Updated on:21/07/2023Similar Questions
Find the area of the figure given below.

View SolutionThe area of the shaded part in the figure given below is ______.

View SolutionThe inequation represented by the graph given below is :
View SolutionThe inequation that best describes the graph given below is _________
View SolutionThe inequation that best describes the following graph is _________
View SolutionWhich inequations represent the shaded region in the given figure
View SolutionIn the given figure, PQRS is a parallelogram. A and B are the mid-point of ¯¯¯¯¯¯PQ and ¯¯¯¯¯SR respectively. If PS=BR, then the quadrilateral ADBC is a…………………… ,
ltimg src="https://d10lpgp6xz60nq.cloudfront.net/physics_images/PS_MATH_IX_C12_E05_020_Q01.png" width="80%"gt
View SolutionMagnitude of slope i.e. steepness of graph shown in figure ltimg src="https://d10lpgp6xz60nq.cloudfront.net/physics_images/ALN_PHY_R04_E01_026_Q01.png" width="80%"gt
View Solution
