Answer the questions based on the information given below: Two person A and B work in a call center. They receive calls of which they execute some percentage. Below bar graph shows the percentage of calls executed by them on 2 days i.e. Monday and Friday. Based on the following graph, answer the questions given below:
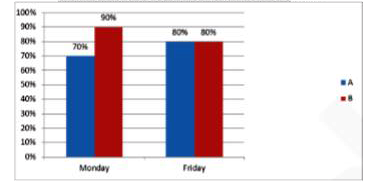
Total calls received by A and B on Friday is?
a) Total calls executed by them on Friday is 100
b) Difference between the calls executed by them on Friday is 8
A) Data in A is sufficient alone
Data in B is sufficient alone
Both A and B are required
Can’t be determined even after using both
Step by step video & image solution for Answer the questions based on the information given below: Two person A and B work in a call center. They receive calls of which they execute some percentage. Below bar graph shows the percentage of calls executed by them on 2 days i.e. Monday and Friday. Based on the following graph, answer the questions given below: Total calls received by A and B on Friday is? a) Total calls executed by them on Friday is 100 b) Difference between the calls executed by them on Friday is 8 by Maths experts to help you in doubts & scoring excellent marks in Class 14 exams.
Updated on:21/07/2023Similar Questions
Answer the questions based on the information given below:
Two person A and B work in a call center. They receive calls of which they execute some percentage. Below bar graph shows the percentage of calls executed by them on 2 days i.e. Monday and Friday. Based on the following graph, answer the questions given below:
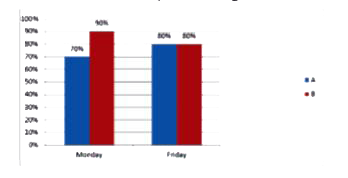
If B executes 200 calls on Friday and he received 25% more calls than A on Friday. Then A executed what number of calls on Friday?
View SolutionBased on the given diagram answer the questions given below :
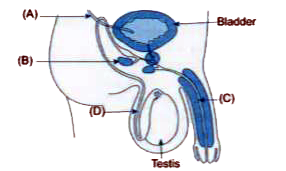
Label the parts A, B, C and D.
View Solution
Knowledge Check
Study the given diagram and answer the question given below:
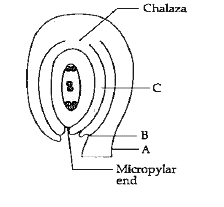
A is the stalk of the ovule is calledAHilumBPedicleCChalazal poleDFunicleStudy the following graph carefully and answer the question given below-----
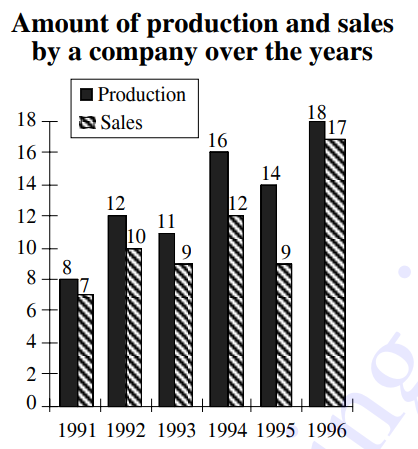
What was the percentage drop in sales from 1992 to 1993 ?A1B10C20D15The following bar graph shows the games played by the students. Study the graph carefully and answer the question given below:
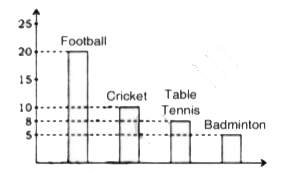
How many students play table tennis?A10B8C18D20
Read the following graph carefully and answer the questions given below:
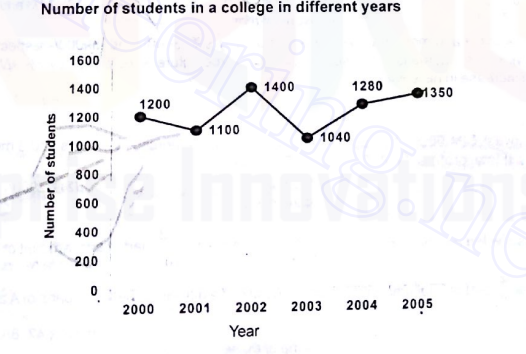
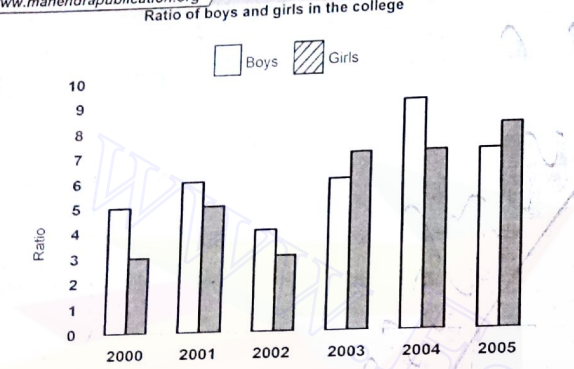
In which two years the number of girls is equal ?
View SolutionStudy the following graph and answer the questions given below it.
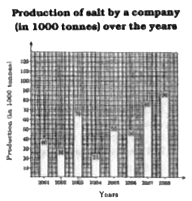
What was the percentage decline in the product of salt from 2003 to 2004 ?
View SolutionBased on the given diagram answer the questions given below :
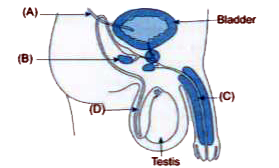
State the functions of B and C in the process of reproduction.
View SolutionStudy the following graph and answer the questions given below it.
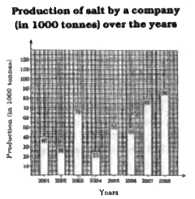
What was the percentage increase in production of salt in 2008 compared to that of 2001 ?
View SolutionStudy the following bar graph and answer the questions given below.
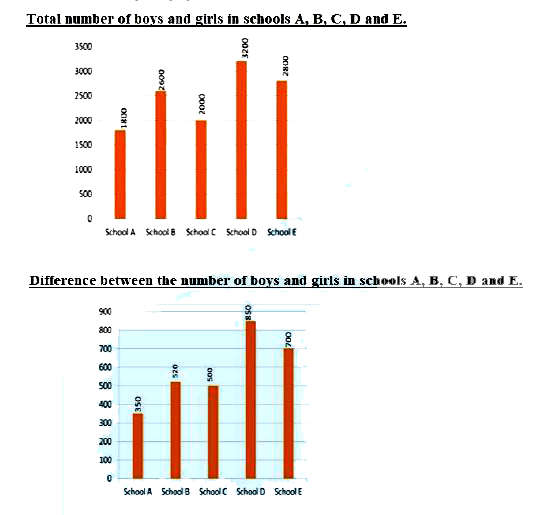
What is the ratio of numbers of boys to the number of girls in school E?
View Solution
