Answer the questions based on the information given below:
The given cascade bar graph provides the information about the number of girls and boys participated in a dance competition of NH Goel school on five different days of a week and the table give the details about the percentage of students participated on different days who lost the competition.
Total number of students participated in a day = Number of girls participated in a day + Number of boys participated in a day
Total number of students participated = Total number of students who lost the competition participated + Total number of students who won the competition participated
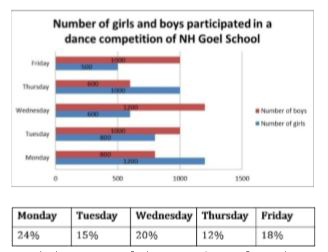
Find the ratio between the number of students who won on Wednesday to the number of students who won on Thursday
Step by step video & image solution for Answer the questions based on the information given below: The given cascade bar graph provides the information about the number of girls and boys participated in a dance competition of NH Goel school on five different days of a week and the table give the details about the percentage of students participated on different days who lost the competition. Total number of students participated in a day = Number of girls participated in a day + Number of boys participated in a day Total number of students participated = Total number of students who lost the competition participated + Total number of students who won the competition participated Find the ratio between the number of students who won on Wednesday to the number of students who won on Thursday by Maths experts to help you in doubts & scoring excellent marks in Class 14 exams.
Updated on:21/07/2023Similar Questions
the given bar graph shows the numbers of puspils who participated in the fitness test in different days of the week .
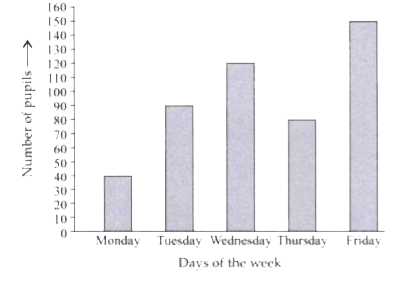
what percentage of the total number of puipil had their test on Wednesday ?
View SolutionIn the given bar graph the percentage difference of boys and girls in which college (considering the total number of students of that college as basis) is maximum?
View SolutionStudy the double bar graph given below and answer the questions.
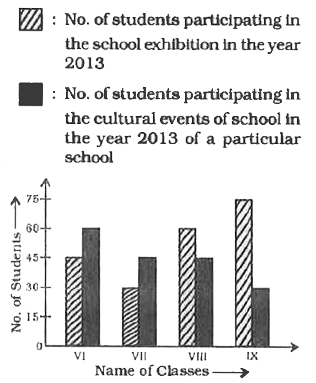
The percentage of students of class VIII participanting in cultural event out of total participants of cultural event is
View SolutionAnswer the questions on the basis of the information given below: Number of players participating in three different games in five different schools.
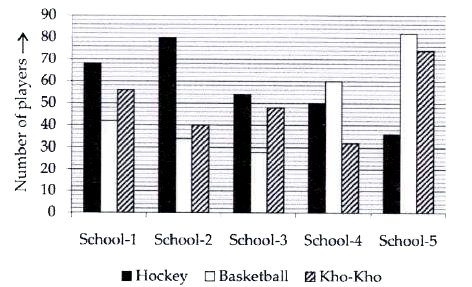
Number of p layers participating in Kho-Kho from School-4 is what percent of number of players participating in hockey from School-2?
View SolutionAnswer the questions on the basis of the information given below: Number of players participating in three different games in five different schools.
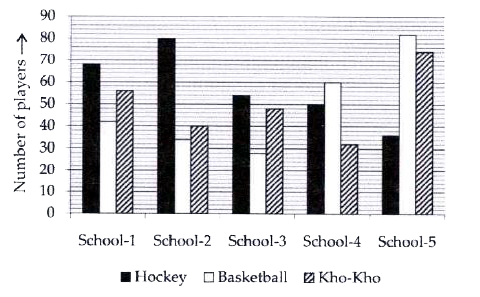
25% of the number of the players participating in hockey from School-5 are females. What is the number of the hockey players who are males in School-5?
View SolutionThe given bar graph represents the number of boys and girls in five different schools. Study the graph and answer the question that follows In which school is the percentage of girls the lowest ?
View SolutionThe given bar graph represents the number of boys and girls in five different schools. Read the graph and answer the question that follows. What is the average number of students (girls and boys) in schools A, B, C, D and E ?
View SolutionThe given bar graph represents the number of boys and girls in five different schools. Read the graph and answer the question that follows. In which school is the percentage of boys more than 55%?
View Solution
