the given bar graph shows the numbers of puspils who participated in the fitness test in different days of the week .
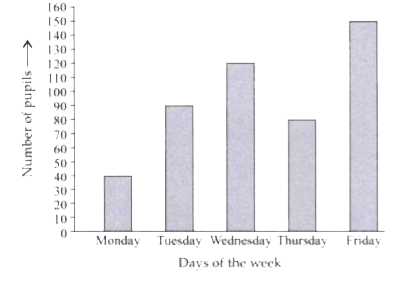
what percentage of the total number of puipil had their test on Wednesday ?
30%
25%
22.5%
27.5%
Step by step video & image solution for the given bar graph shows the numbers of puspils who participated in the fitness test in different days of the week . what percentage of the total number of puipil had their test on Wednesday ? by Maths experts to help you in doubts & scoring excellent marks in Class 7 exams.
Updated on:21/07/2023Topper's Solved these Questions
- DATA HANDLINGBOOK - MTG IIT JEE FOUNDATIONCHAPTER - DATA HANDLINGEXERCISE - Exercise (Level - 2) Subjective Problems
10 Videos
- CONGRUENCE OF TRIANGLES BOOK - MTG IIT JEE FOUNDATIONCHAPTER - CONGRUENCE OF TRIANGLES EXERCISE - Olympiad/HOTS Corner
10 Videos
- EXPONENTS AND POWERSBOOK - MTG IIT JEE FOUNDATIONCHAPTER - EXPONENTS AND POWERSEXERCISE - OLYMPIAD/HOTS CORNER
15 Videos
Similar Questions
The given bar graph, shows the number of students in different classes.
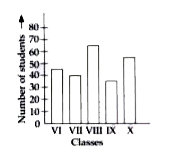
Find the total number of students in the classes VIII to X.
View SolutionAnswer the questions based on the information given below:
The given cascade bar graph provides the information about the number of girls and boys participated in a dance competition of NH Goel school on five different days of a week and the table give the details about the percentage of students participated on different days who lost the competition.
Total number of students participated in a day = Number of girls participated in a day + Number of boys participated in a day
Total number of students participated = Total number of students who lost the competition participated + Total number of students who won the competition participated
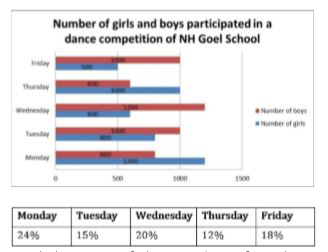
Find the ratio of the number of students who lost the competition on Tuesday to the number of students who won the competition on Wednesday.
View Solution
Knowledge Check
The given bar graph shows the number of students of two schools over a period of six years.
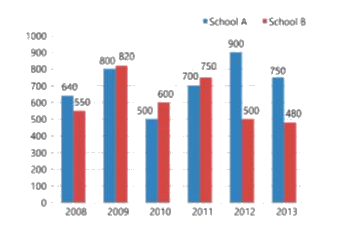
In the bar graph, what is the ratio of the average of the total students from school A to the average of the total students from school B ?A429:799B370:429C429:370D799:429
Answer the questions based on the information given below:
The given cascade bar graph provides the information about the number of girls and boys participated in a dance competition of NH Goel school on five different days of a week and the table give the details about the percentage of students participated on different days who lost the competition.
Total number of students participated in a day = Number of girls participated in a day + Number of boys participated in a day
Total number of students participated = Total number of students who lost the competition participated + Total number of students who won the competition participated
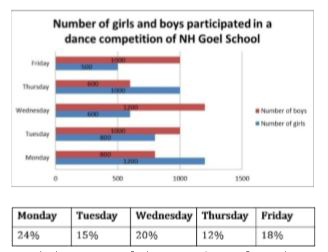
Find the ratio between the number of students who won on Wednesday to the number of students who won on Thursday
View SolutionAnswer the questions based on the information given below:
The given cascade bar graph provides the information about the number of girls and boys participated in a dance competition of NH Goel school on five different days of a week and the table give the details about the percentage of students participated on different days who lost the competition.
Total number of students participated in a day = Number of girls participated in a day + Number of boys participated in a day
Total number of students participated = Total number of students who lost the competition participated + Total number of students who won the competition participated
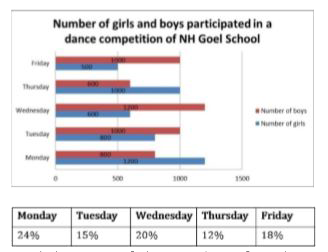
If the ratio of number of girls lost to the number of boys lost on Thursday is 7: 5 respectively, then the number of girls lost on Thursday was what percentage of the number of boys participated on Monday?
View SolutionThe bar chart given below shows the number of audience in a multiscreen theatre for three shows .
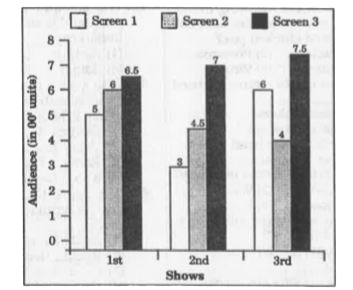
What is the percentage increase in the total number of audience second show to third show ?
View SolutionThe given bar graph, shows the number of students in different classes.
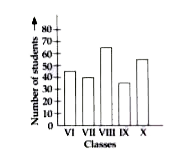
Arrange the classes in descending order of student population.
View SolutionThe given bar graph represents the number of students who appeared in the board examination in session 2017-18 and 2018-19. Study the graph and answer the question that follows.
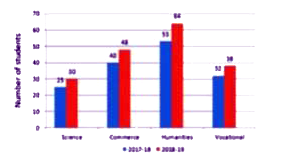
What percentage is the total number of students who appeared in 2017-18 is less than the total number of students who appeared in 2018-19?
View SolutionThe given bar graph shows the marks obtained by students in a Science test.
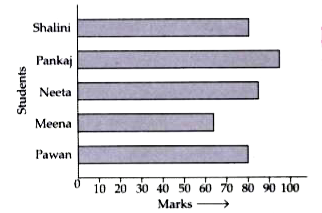
Who scored the highest marks in the test ? Whats in the score ?
View SolutionThe bar graph shows the number of toys produced by a factory during a certain week.
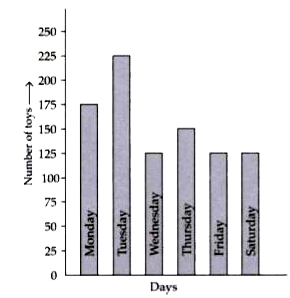
What is the total number of toys produced during the week ?
View Solution
