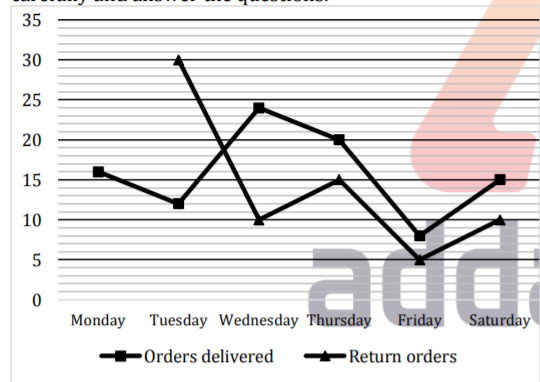
Study the line graph given below to answer the following questions.
The line graph given below shows the percentage of orders delivered from Monday to Saturday of week III out of the orders received on Sunday of Week II and it also shows the number of orders returned on any given day as a percentage of total number of orders delivered till previous day.

Note: • Number of orders which were yet to be delivered after Saturday of week III were 25.
• Orders cannot be returned on the same day of delivery. It has to be returned on next day of delivery and no order was returned on Sunday of Week III.
If 25 orders were returned on Sunday of week III, then what percent of the total number of orders placed on Sunday of week II were not returned by the customers till Sunday of week 2?
A
64%
B
66%
C
68%
D
70%
Video Solution
Text Solution
The correct Answer is:C
Total percentage of orders delivered from Monday to Saturday of week III = 16% + 12% + 24% + 20% + 8% + 15% = 95%
Remaining Orders = 100% – 95% = 5%
It is given that, number of orders which were not delivered = 25
Thus, 5% of total orders = 25
So, total number of orders received on Sunday of week II = 25×1005 = 500
Now, we can calculate the number of orders delivered on each day and also the number of orders which were returned.

Total number of orders returned till Sunday of week III = 24 + 14 + 39 + 18 + 40 + 25 = 160
Number of orders which were not returned = 500 – 160 = 340
Required percentage = 340500×100 = 68%
Hence, option C is the correct answer.
|
Updated on:21/07/2023
Similar Questions
Find the area of the figure given below.
 02:21View Solution
The area of the shaded part in the figure given below is ______.
 02:03View Solution
The inequation represented by the graph given below is :
02:10View SolutionThe inequation that best describes the graph given below is _________
02:17View SolutionThe inequation that best describes the following graph is _________
02:10View SolutionWhich inequations represent the shaded region in the given figure
04:23View SolutionWhich of the following statement is not correc for following straight line graph :-
ltimg src="https://d10lpgp6xz60nq.cloudfront.net/physics_images/ALN_PHY_R04_E01_015_Q01.png" width="80%"gt02:24View SolutionThe total surface area of the given solid figure is _______________.
 01:52View Solution

