The line graph given below shows the number of text messages received by Keerthi during a week. Study The graph carefully and answer the questions that follow.
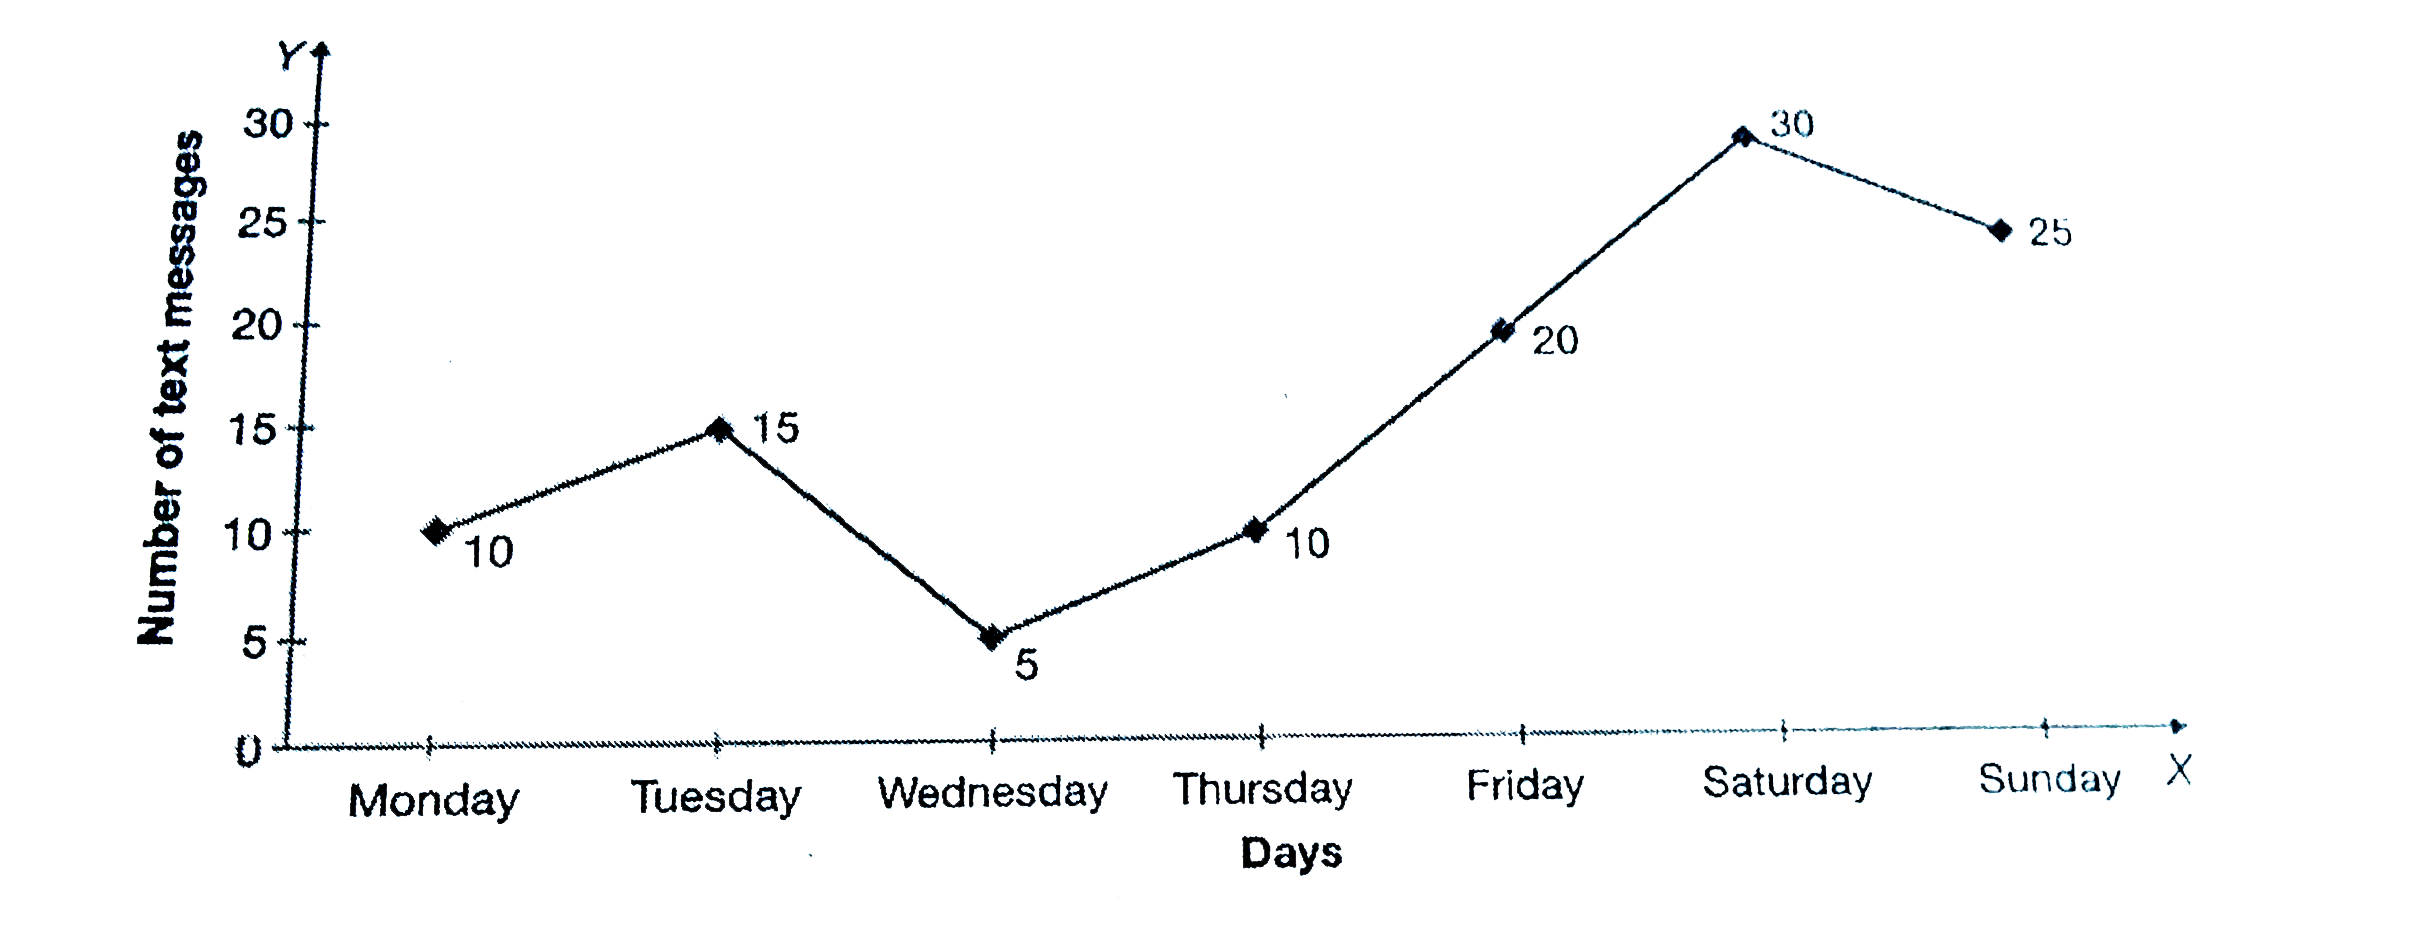
(i) On which day did Keerthi receive exactly 20 text message ?
(iii) Find the total number of text messages received by Keerthi in week.
The correct Answer is:(i) Wednesday , (ii) Friday
(iii) 115
(i) Wednesday
(ii) Friday
(iii) The total number of text messager received by Keerthi
=10+15+5+10+20+30+25=115
Topper's Solved these Questions
- BOOK - PEARSON IIT JEE FOUNDATIONCHAPTER - STATISTICSEXERCISE - CONCEPT APPLICATION5videos
STATISTICS
- BOOK - PEARSON IIT JEE FOUNDATIONCHAPTER - STATISTICSEXERCISE - ASSESSMENT TEST10videos
STATISTICS
- BOOK - PEARSON IIT JEE FOUNDATIONCHAPTER - STATISTICSEXERCISE - TEST YOUR CONCEPTS (VERY SHORT ANSWER TYPE QUESTION )11videos
STATISTICS
- BOOK - PEARSON IIT JEE FOUNDATIONCHAPTER - SETSEXERCISE - Crossword1videos
SETS
Similar Questions
Read the following graph carefully and answer the questions given below:
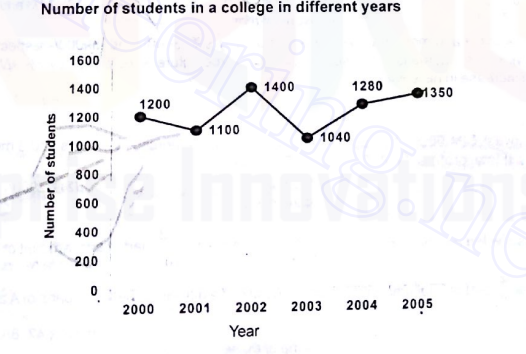
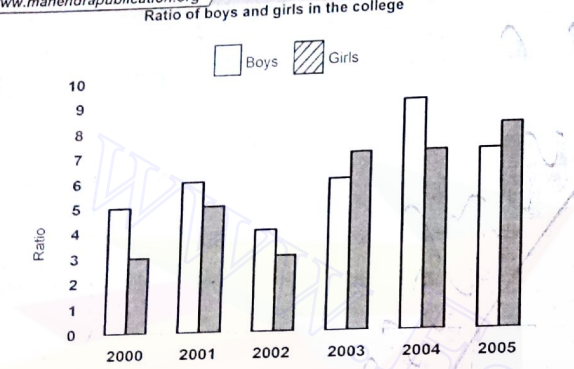
In which two years the number of girls is equal ?View SolutionA man started his journey on his car from location A and came back. The graph given below shows his position at different times during the whole journey.
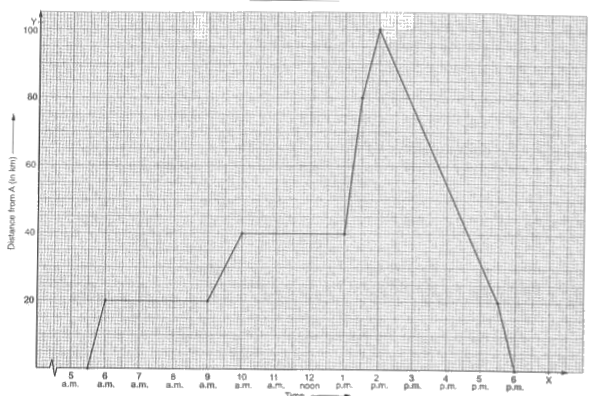
Study the above graph carefully and answer the questions that follow:
(i) At what time did he start and end his journey ?
(ii) What was the total duration of the journey ?
(iii) Which journey, onward or return, was of longer duration?
(iv) For how many hours did he not move ? (v) At what time did he have the fastest speed ?View Solution
Knowledge Check
- Question 1 - Select One
The circle - graph given here shows the spendings of a country on various sports during a prticular year. Study the graph carefully and answer the questions given below It .
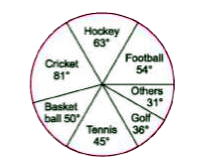
What per cent of the total spendings is Sent on Tennis ?A1212 %B2212 %C0.25D0.45 - Question 2 - Select One
The circle graph given here shows the spendings of a country on various sports during a particular year, study the graph carefully and answer the questions given below it.
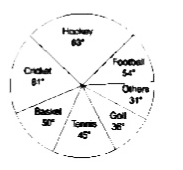
What per cent of the total spendings is spent on tennis ?A1212%B2212%C25%D45% - Question 3 - Select One
The following line graph shows the ratio of imports and exports of a company during a period of 1995-2001. Study the graph carefully and answer the questions.
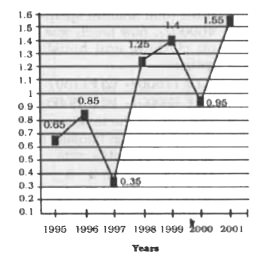
In which year was the ratio of imports to exports maximum ?A2000B1998C1996D2001
The following bar graph shows the number of deaths from road accidents occurred during the rainy season in the year 1992. Study the graph carefully and answer the question.
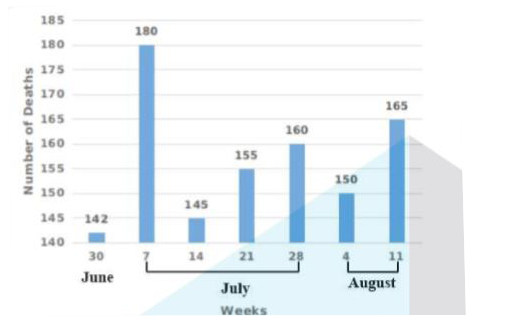
Between which two consecutive weeks was the rise in the number of deaths the greatest?View SolutionThe following bar graph shows the number of deaths from road accidents occurred during the rainy season in the year 1992. Study the graph carefully and answer the question.
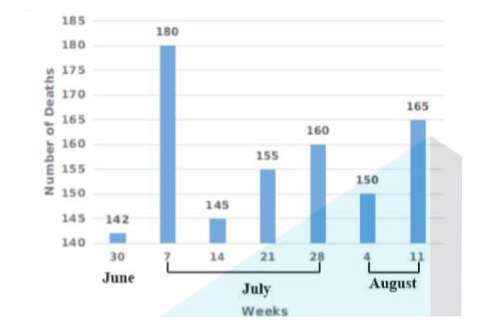
Between which two consecutive weeks was the fall in the number of deaths the greatest?View SolutionThe bar graph given here shows the number of jobseekers of a state in various years at different stages of education.
Study the graph carefully and answer the question based on it.
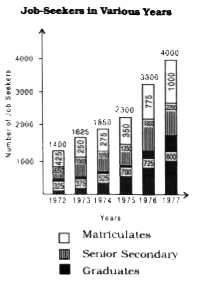
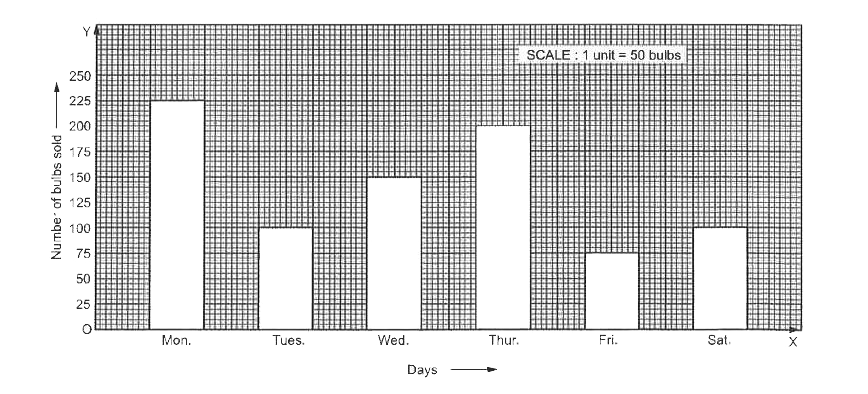
In which year, was the number of Matriculate job-seekers maximum ?View SolutionGiven below is a graph showing the number of electric bulbs sold in a shop during a week
Read the bar graph carefully and answer the following questions
(i) On which day of the week was the sale minimum?
(ii) On which day of the week was the sale maximum
(iiI) What was the total sale during the week
(lv) What is the ratio between the minimum sale and the maximum sale
 View Solution
Study the following graph carefully and answer the questions that follow
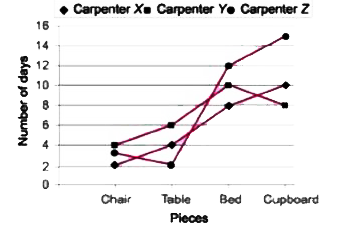
What is the total number of days that carpenter Z will take to make one piece each of all items together ?View Solution

