Study the following graph carefully to answer the question given below:
Given below is the demand and production of 6 brands (in units) of a product in the year 2016.
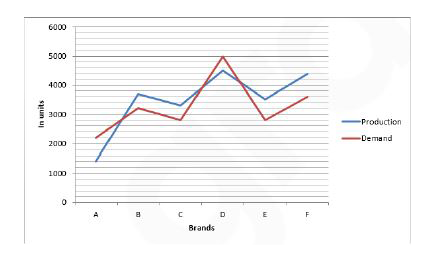
The production of brand E and F took together is approx. what percent of total demand of E and F?
81%
21%
123%
121%
Step by step video & image solution for Study the following graph carefully to answer the question given below: Given below is the demand and production of 6 brands (in units) of a product in the year 2016. The production of brand E and F took together is approx. what percent of total demand of E and F? by Maths experts to help you in doubts & scoring excellent marks in Class 14 exams.
Updated on:21/07/2023Similar Questions
Study the following graph carefully to answer the question given below:
Given below is the demand and production of 6 brands (in units) of a product in the year 2016.
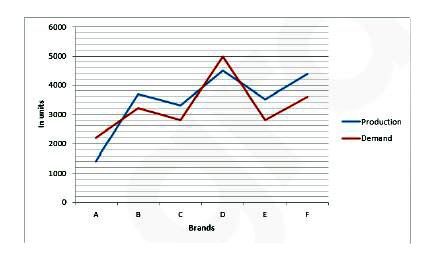
The demand for brand D product fell. The new demand is 20% less than its production. Find by what percentage demand fell?
View SolutionStudy the following graph carefully to answer the question given below:
Given below is the demand and production of 6 brands (in units) of a product in the year 2016.
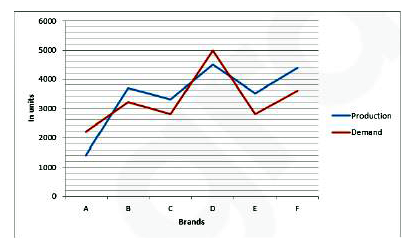
If the demand for brand C product increase by 75% then to meet the demand production should be increased by what percent?
View Solution
Knowledge Check
Study the following graph carefully to answer the questions given below.
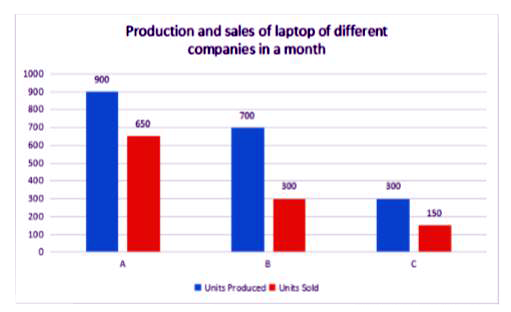
What is the average number of Units produced by all the Companies together?A62513B63313C63323D62313Study the following graph carefully and answer the questions given below
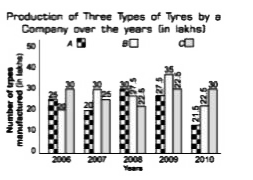
In which of the following years, was the percentage production of B type to C type the maximum?A2008B2009C2010D2007Study the following graph carefully to answer the questions given below.
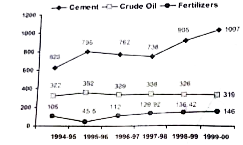
Find the approximate percentage increase in Cement production from 1994-95 to 1999-00 ?A0.55B0.6C0.65D0.69
Study the following graph carefully to answer the question given below:
Given below is the demand and production of 6 brands (in units) of a product in the year 2016.
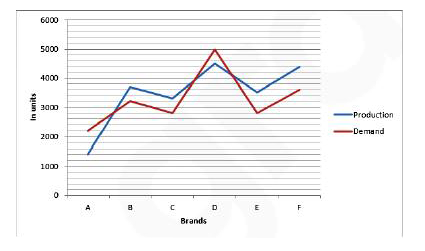
Brand B decreased its price of the product to meet its demand to its production. When the price decreased by 12% the demand increased by 25%. If the ratio between the new price and new demand is 11:20 then find the price of the product before the decrease.
View SolutionStudy the following graph carefully to answer the question given below:
Given below is the demand and production of 6 brands (in units) of a product in the year 2016.
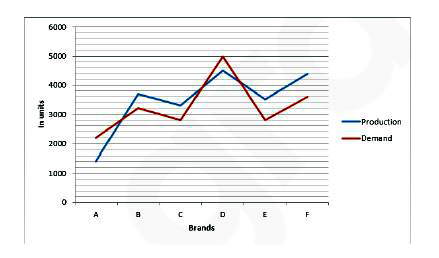
Brand A increase its production to meet its demand. With every 160 unit produced the brand increases its price by 10%. If the earlier price of one product was INR 5000 then find the new price of the product.
View SolutionStudy the following graph and answer the questions given below it.
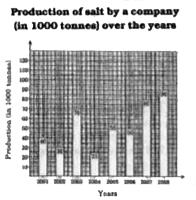
In how many of the given years was the production of salt more than the average production of the given years?
View SolutionStudy the following graph carefully to answer the questions given below.
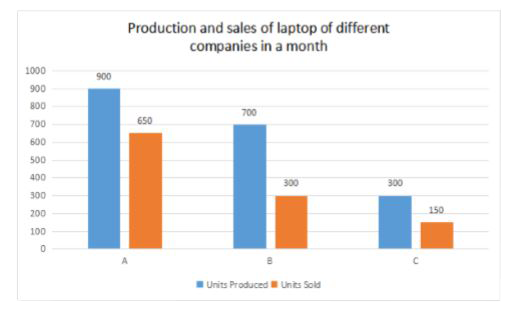
What is the average number of Units of laptop sold by all the Companies together?
View SolutionExamine the following graph carefully and answer the questions given below it :
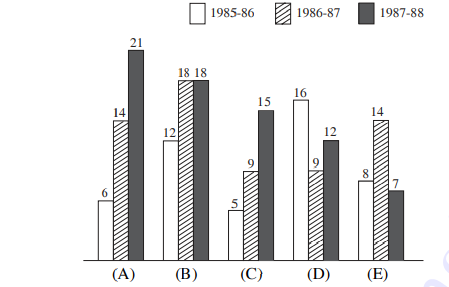
The production of state D in 1986-87 is how many times its production in 1987-88 ?
View Solution
