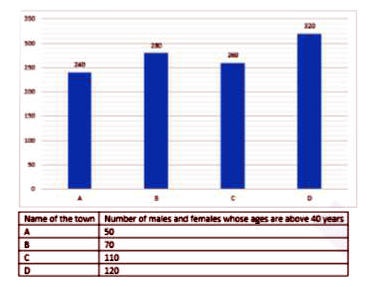
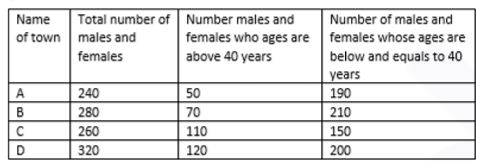
The bar graph shows the total number of male and female lives in four different towns and table shows the number of males and females whose ages are above 40 years. Read the data carefully and answer the questions below:

Find the average number of those males and females whose ages are below and equals to 40 years of town A, C and D.
180
160
190
200
The correct Answer is:A

Required average = (190 + 150 + 200) ÷ 3
= 540 ÷ 3
= 180
Similar Questions
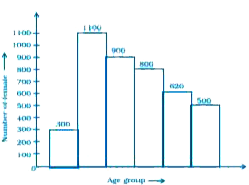
The below histogram shows the number of literate females in the age group of 10 to 40 years in a town.

In which age group is the number of literate females the highest?01:41View SolutionThe graph below shows the percentage of readers of different newspapers and the array below shows the ratio of the number of male and female readers above and below 40 years. 'Hindustan Times' has 6 lakh male readers who are above 40 years of age and 3 lakh female readers who are below 40 years of age. 25% of the readers of Dainik Jagran are below 40 years of age. What is the difference (in lakhs) between male and female readers of this newspaper above 40 years?
06:33View SolutionIn a town, the population was 8000. In one year, male population increased by 10% and female population increased by 8% but the total population increased by 9%. The number of males in the town was:
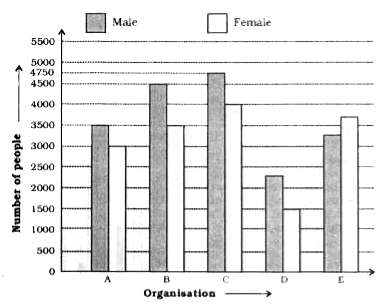
01:53View SolutionThe following bar-diagram shows total number of males and females in five different organisations. Study it carefully to answer the questions.

What is the difference between the total number of females and the total number of males from all the organisations together?03:37View SolutionThe total numbers of males and females in a town is 70,000. If the number of males is increased by 6% and that of the females is increased by 4% , then the total numbers of males and females in the town would become 73520. Whatis the difference between the numberof males and females in the town, in the beginning?
04:04View SolutionThe average age of all the employees in an office is 42 years. 60% of the employees are males and the rest are females, The ratio of the average age of males to that of females is 6:5. What is the average age (in years) of male employees?
04:31View SolutionThe bar graph shows the total number of male and female lives in four different towns and table shows the number of males and females whose ages are above 40 years. Read the data carefully and answer the questions below: Find the ratio of the those number of males and females whose ages are above 40 years in town A and B to those males and females whose ages are below and equals to 40 years in town D.
03:07View Solution

