दिसम्बर, 2017 में, आयकर विभाग द्वारा जारी आंकड़ों के अनुसार, आकलन वर्ष 2015-16 में कुल जनसंख्या के कितने प्रतिशत ने आयकर चुकाया था?
1.7
5.7
9.7
11.7
The correct Answer is:A
दिसम्बर 2017 में आई-टी विभाग द्वारा जारी आंकड़ों के अनुसार, कुल 2 करोड़ भारतीयों या कुल आबादी का 1.7 प्रतिशत, निर्धारण वर्ष (एवाई) 2015-16 में आयकर चुकाया गया। आयकर रिटर्न फाइलर्स की संख्या पिछले वर्ष 3.65 करोड़ से निर्धारण वर्ष 2015-16 (वित्त वर्ष 2014-2015) में 4. 07 करोड़ हो गई, लेकिन वास्तव में केवल 2.06 करोड़ रुपये का भुगतान किया गया, क्योंकि अन्य लोगों द्वारा कर योग्य सीमाओं के नीचे आय का दावा किया गया था।
Similar Questions
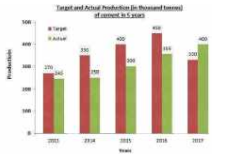
The bar graph given below shows the target and actual production of cement ( in thousand tons ) during 2013-2017. What percentage of the total targeted production of cement from 2013 to 2017 is the total actual production in 2014, 2015 and 2017? ( correct to one decimal place )
नीचे दिया गया दंड आरेख 2013-2017 के दौरान सीमेंट के लक्षित और वास्तविक उत्पादन (हजार टन में) को दर्शाता है |
2013 से 2017 तक सीमेंट के कुल लक्षित उत्पादन का कितना प्रतिशत, 2014, 2015 और 2017 में कुल वास्तविक उत्पादन है ? (दशमलव के एक स्थान तक)
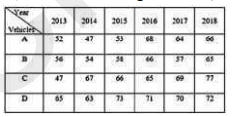
View SolutionThe table given below presents the figures of the production (in thousands) of different types of vehicles by a company during the year 2013-18.
नीचे दी गयी तालिका वर्ष 2013-18 के दौरान एक कंपनी के द्वारा विभिन्न प्रकार के वाहनों के उत्पादन ( हज़ार में)के आंकड़ों को प्रस्तुत करती है | The ratio of the total production of type A vehicles in 2013 and 2016 to the total production of type C vehicles during 2015 to 2017 is:
2013 तथा 2016 में A प्रकार के वाहनों के कुल उत्पादन एवं 2015 से 2017 के दौरान C प्रकार के वाहनों के कुल उत्पादन में अनुपात ज्ञात करें |
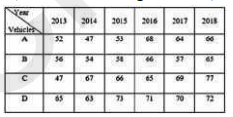
View SolutionThe table given below presents the figures of the production (in thousands) of different types of vehicles by a company during the year 2013-18.
नीचे दी गयी तालिका वर्ष 2013-18 के दौरान एक कंपनी के द्वारा विभिन्न प्रकार के वाहनों के उत्पादन ( हज़ार में)के आंकड़ों को प्रस्तुत करती है | The total production of all types of vehicles in 2018 is what percent more than the total production of all types of vehicles in 2015?
2018 में सभी प्रकार के वाहनों का कुल उत्पादन 2015 में सभी प्रकार के वाहनों के कुल उत्पादन से कितना प्रतिशत अधिक है ?
View SolutionStudy the graph and answer the question that follows
आरेख का अध्ययन करें और प्रश्न का उत्तर दे।
By what percent were the total export of the computers by the company in 2013, 2014 and 2018 less than the total production of computers in 2015 to 2017 (correct to one decimal place)?
कंपनी द्वारा वर्ष 2013, 2014 और 2018 में कंप्यूटर के कुल उत्पादन की तुलना में वर्ष 2015 से 2017 का कुल निर्यात कितने प्रतिशत कम था? (एक दशमलव स्थान तक )
View Solutionछात्रों के लिखित कार्य के आकलन में सर्वाधिक महत्त्वपूर्ण है
View Solutionबच्चों के लिखित कार्य के आकलन में सर्वाधिक महत्त्वपूर्ण है
View SolutionThe given Bar Graph presents the Revenue and Expenditure (in crores of Rupees ) of a company during the five year period , 2014 - 2018. दिया गया दंड आरेख (bar graph) 5 वर्ष की अवधि 2014-2018 के दौरान किसी कंपनी के राजस्व और व्यय (करोड़ रुपए में ) को दर्शाता है। The expenditure of the company in 2017 is what percentage less than the average revenue ( per year ) in 2014, 2015 and 2016 ? वर्ष 2017 में कंपनी का व्यय, वर्ष 2014, 2015 और 2016 में औसत राजस्व (प्रति वर्ष) से कितने प्रतिशत कम है?
View SolutionThe percentage of the total production of flavour R in 2007 and 2008 with respect to the production of flavour P in 2005 and 2006 is : वर्ष 2007 तथा 2008 में गन्ध R का कुल उत्पादन, वर्ष 2005 तथा 2006 में गन्ध P के उत्पादन की तुलना में कितने प्रतिशत रहा है?
View Solution
