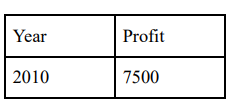
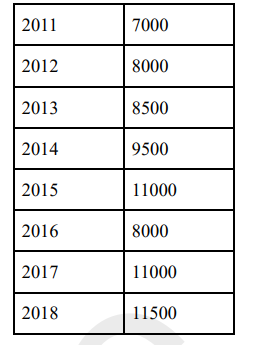
The bar graph given below shows the profit (in multiples of thousand rupees) of a company during the year 2010-2018. The average profit for the year 2015-2017 is what percentage more than the 2012 profit?
नीचे दिए गए दंड आरेख में वर्ष
2010-2018 के दौरान किसी कंपनी के लाभ (हजार रुपए के गुणक में) को दर्शाया गया है | वर्ष 2015-2017 का औसत लाभ 2012 के लाभ से कितना प्रतिशत अधिक है ?
33.33
25
50
12.5
Step by step video & image solution for The bar graph given below shows the profit (in multiples of thousand rupees) of a company during the year 2010-2018. The average profit for the year 2015-2017 is what percentage more than the 2012 profit? नीचे दिए गए दंड आरेख में वर्ष 2010-2018 के दौरान किसी कंपनी के लाभ (हजार रुपए के गुणक में) को दर्शाया गया है | वर्ष 2015-2017 का औसत लाभ 2012 के लाभ से कितना प्रतिशत अधिक है ? by Maths experts to help you in doubts & scoring excellent marks in Class 14 exams.
Updated on:21/07/2023Topper's Solved these Questions
Similar Questions
The bar graph given below shows the wheat production (in tonnes) of a large farm during the year 2011-2018. In how many years was wheat production higher than the average production of the period?
नीचे दिए गए दंड आरेख में वर्ष 2011-2018 के दौरान किसी बड़े फार्म के गेहूं उत्पादन (टन में) को दर्शाया गया है | अवधि के औसत उत्पादन की तुलना में दिए गए कितने वर्षो में गेहूं उत्पादन अधिक था ?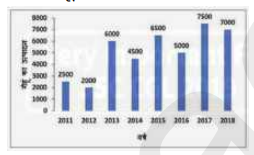
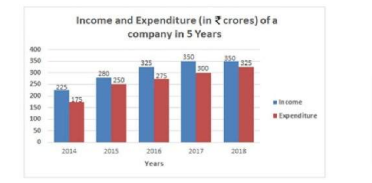
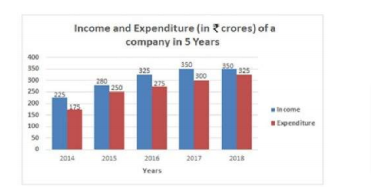
View SolutionThe given Bar Graph presents Income and Expenditure (in crores of Rupees) of a company for five years, 2014 to 2018. The average Income (per year) of the company in five years is what percentage more than its Expenditure in 2015? दिया गया दंड आरेख॑ (बार ग्राफ) 5 वर्षों, 2014 से 2018 के दौरान किसी कंपनी की आय और व्यय (करोड़ रुपए में) को दर्शाता है| 5 वर्षों में कंपनी की (प्रतिवर्ष) औसत आय 2015 में उसके व्यय से कितने प्रतिशत अधिक है?
View Solution
Knowledge Check
The Table given below presents the profit (in multiple of thousand rupees) of a firm for the years 2010-2018. By how much percentage is the average profit of years 2015-2017 greater than the profit of 2012?
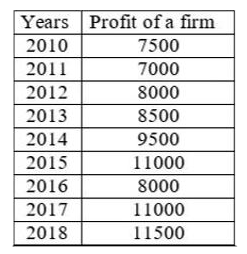 A50B12.5C25D33.33
The line chart given below shows the profit (in crores) of a company for the years 2008 to 2015.
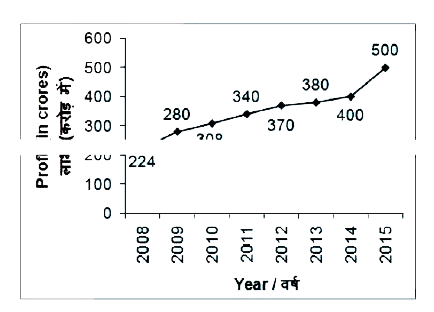
What is the percentage increase in profit in the year 2010 in comparison to the previous year ?Aa)20Bb)12Cc)10Dd)25
The given Bar Graph presents the number of different types of vehicles exported by a company in 2017 and 2018.The average export of vehicles in 2018 is what percent more than the export of vehicle A in 2017?
दिया गया दंड आरेख एक कंपनी के द्वारा 2017 और 2018 में निर्यात किये गए अलग-अलग प्रकार के वाहनों की संख्या को दर्शाता है |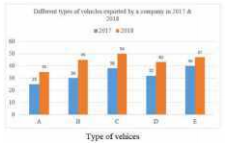
2018 में वाहनों का औसत निर्यात 2017 में वाहन A के निर्यात से कितना प्रतिशत अधिक है ?
View SolutionThe bar graph given below shows the target and actual production of cement ( in thousand tons ) during 2013-2017. The ratio of the target production in 2014 and 2016 to the actual total production in 2013, 2016 and 2017 is :
नीचे दिया गया दंड आरेख 2013-2017 के दौरान सीमेंट के लक्षित और वास्तविक उत्पादन (हजार टन में) को दर्शाता है |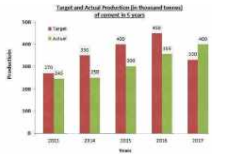
वर्ष 2014 और 2016 में सीमेंट के कुल लक्षित उत्पादन और 2013, 2016 तथा 2017 में कुल वास्तविक उत्पादन का अनुपात है :
View SolutionThe given Bar Graph presents Income and Expenditure (in crores of Rupees) of a company for five years, 2014 to 2018. The total Income of the company in 2015, 2017 and 2018 is approximately what percent less than the total Expenditure in the five years? दिया गया दंड आरेख (बार ग्राफ) 5 वर्षो, 2014 से 2018 के दौरान किसी कंपनी की आय और व्यय (करोड़ रुपए में) को दर्शाता है 2015, 201 और 2018 में कंपनी की कुल आय, 5 वर्षो में कुल व्यय से लगभग कितने प्रतिशत कम है?
View SolutionThe given Bar Graph presents the Revenue of Expenditure (in crores of rupees) of a company during the five year period, 2014 - 2018.
दिया गया दंड आरेख (Bar graph) 5 वर्ष की अवधि 2014-2018 के दौरान किसी कंपनी के राजस्व और व्यय (करोड़ रुपए में) को दर्शाता है|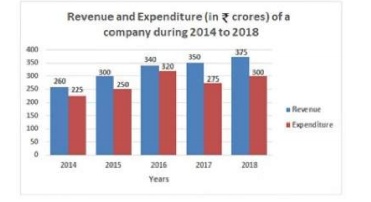 वर्ष 2016 से 2018 तक कंपनी का कुल व्यय, 5 वर्ष की अवधि के कुल राजस्व का कितना प्रतिशत )पूर्णांक के करीब है)?
The total expenditure of the company from 2016 - 2018 is what percentage (nearest to an integer) of the total revenue of the five year period?
View SolutionThe bar graph given below shows the target and actual production of cement ( in thousand tons ) during 2013-2017. Out of given 5 years, in which years the target production of the cement was 45% more than the average actual production ?
नीचे दिया गया दंड आरेख 2013-2017 के दौरान सीमेंट के लक्षित और वास्तविक उत्पादन (हजार टन में) को दर्शाता है |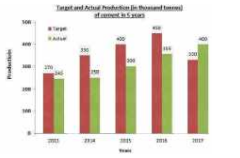
दिए गए 5 वर्षों में से किन वर्षों में सीमेंट का लक्षित उत्पादन, सीमेंट के औसत वास्तविक उत्पादन से 45% अधिक था ?
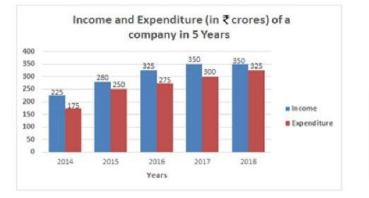
View SolutionThe given Bar Graph presents Income and Expenditure (in crores of Rupees) of a company for five years, 2014 to 2018. In which year is the Expenditure more than 40% as compared to the Expenditure in the previous year? दिया गया दंड आरेख (बार ग्राफ) 5 वर्षो, 2014 से 2018 के दौरान किसी कंपनी की आय और व्यय (करोड़ रुपए में) को दर्शाता है| पिछले वर्ष के व्यय की तुलना में किस वर्ष में वह 40% अधिक है?
View Solution
