The velocity-time graph for a particle moving on a straight line is shown in Fig.
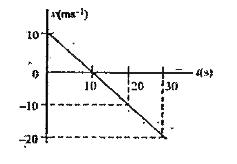
The particle has a constant acceleration
The particle has never turned around
The particle has zero displacement
The average speed in the intervalo to 10 s is the same
The correct Answer is:A, D
A, D Since the graph is a straight line, its slope is constant. It means acceleration of the particle is constant. Velocity of the particle changes from positive to negative at , so particle changes direction at this time. The particle has zero displacement upto 20 s, but not for the entire motion. The average speed in the interval of 0 to 10 s is the same as the average speed in the interval of 10 sto 20 s because distance covered in both time intervals is same.
Similar Questions
The velocity-time graph of a particle moving along a straight line is shown is Fig. The rate of acceleration and deceleration is constant and it is equal to 5ms−2. If the a average velocity during the motion is 20ms−1, Then
 .
.
The maximum velocity of the particle is .
View SolutionThe velocity-time graph of a particle moving along a straight line is shown is Fig. The rate of acceleration and deceleration is constant and it is equal to 5ms−2. If the a average velocity during the motion is 20ms−1, Then
 .
.
The maximum velocity of the particle is .
View Solution
Knowledge Check
The velocity-time graph of a particle moving along a straight line is shown is Fig. The rate of acceleration and deceleration is constant and it is equal to 5ms−2. If the a average velocity during the motion is 20ms−1, Then
 .
.
The maximum velocity of the particle isA20ms−1B25ms−1C30ms−1D40ms−1The velocity-time plot for a particle moving on a straight line is shown in figure.
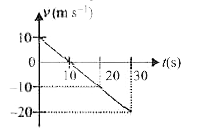 AThe particle has a constant acceleration.BThe particle has never tumed around.CThe particle has zero displacement.DThe average speed in the interval 0 to 10 s is the same as the average speed in the interval 10s to 20 s.
The velocity - time graph of a particle moving along a straight line is shown in the figure given below
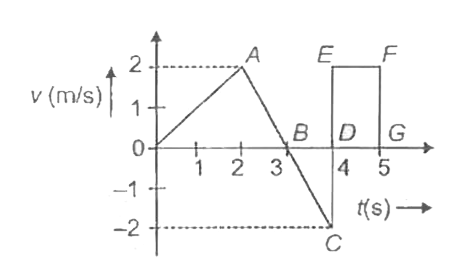
The displacement of the particle in 5 second isA0.5 mB1 mC2 mD4 m
The velocity-time graph of a particle moving along a straight line is shown id Fig. 2 (b) . 33. Calculate the distance covered between t=0 to t=10seconds. Also find displacement tn time 0→10seconds.
 .
.
View SolutionThe velocity-time graph of a particle moving along a straight line is shown in Figure 2.W7.Is the motion uniform?
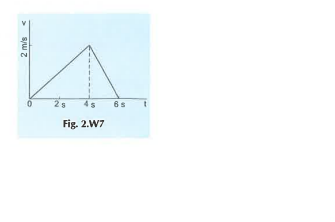
View SolutionThe velocity-time graph of a particle moving along a straight line is shown in Figure 2.W7.
Does the particle change its direction of motion ?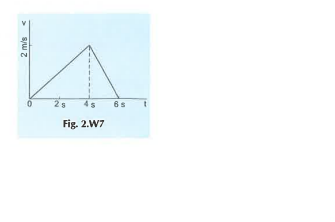
View SolutionThe velocity-time graph of a particle moving along a straight line is shown in the figure-given below
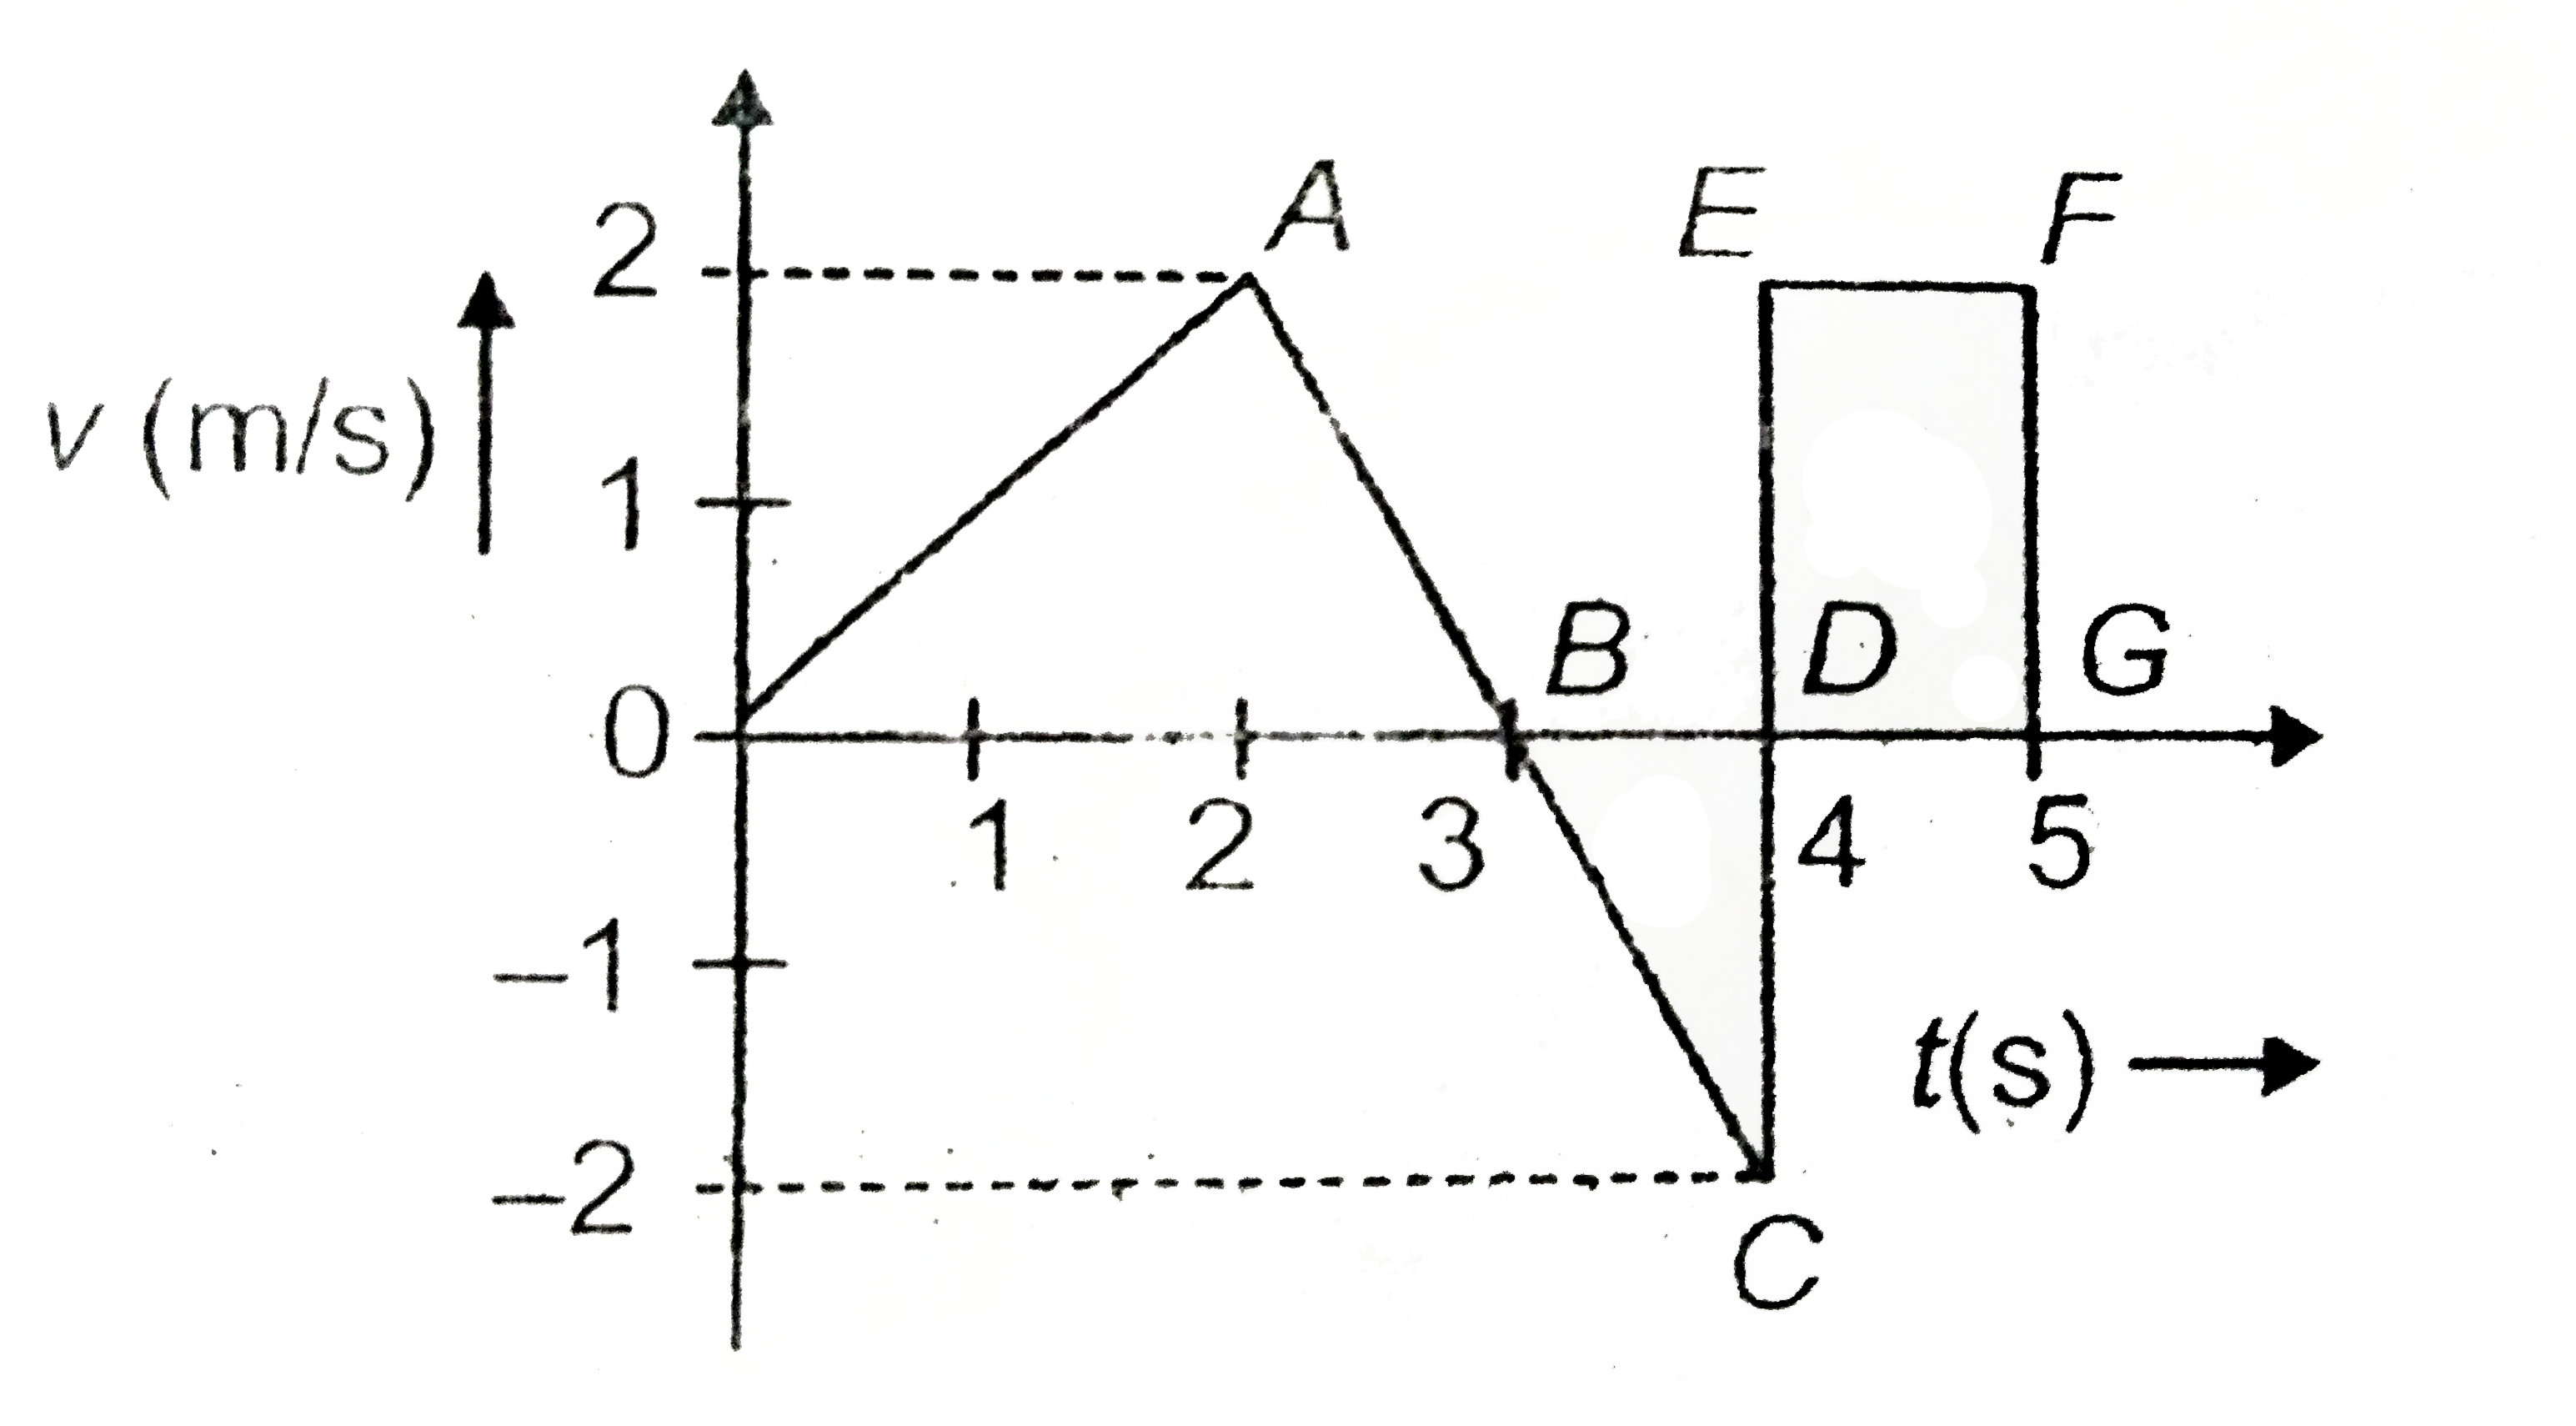
The displacement of the particle in 5 second is
View SolutionThe velocity - time graph of a particle moving along a straight line is shown in the figure given below
The displacement of the particle in 5 second is

View Solution
