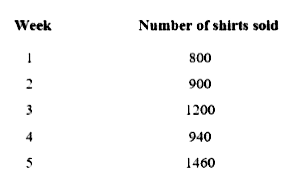
If the following data is plotted in a pie chart, find the measure of the central angle for the sector that denotes the third week . Choose the closest option.
72∘
81.5∘
61.2∘
63.8∘
The correct Answer is:B
Step by step video, text & image solution for If the following data is plotted in a pie chart, find the measure of the central angle for the sector that denotes the third week . Choose the closest option. by Maths experts to help you in doubts & scoring excellent marks in Class 14 exams.
Similar Questions
Knowledge Check
- Question 1 - Select One
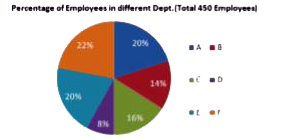
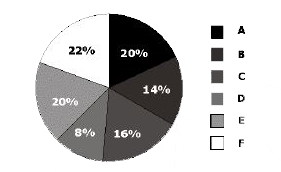
In the given pie-chart, what is the central angle of the sector representing the number of employees in the department D?A29.6∘B28.8∘C29.2∘D29.8∘ - Question 2 - Select One
The table shows the production of different types of cars ( in thousands).
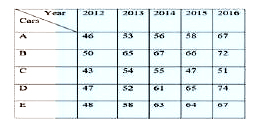
If the data related to the production of type B cars is represented by a pie chart, then the central angle for the sector representing the production of cars in 2016 is :AA) 73∘BB) 75∘CC) 81∘DD) 56∘ - Question 3 - Select One
The table shows the production of different types of cars (in thousands).
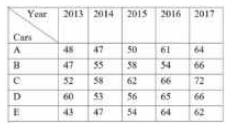
If the data related to the production of type D cars is represented by a pie chart, then the central angle of the sector representing the production of cars in 2016 will be:A56∘B90∘C75∘D73∘
In the given pie chart what is the central angle of the sector representing the number of employees in the department D?
 View Solution
The central angle of the sectors in a pie chart will be a fraction of 360∘
View SolutionWhat is the central angle of the sector in the pie chart representing skin and bones together?
 View Solution
What is the central angle of the sector in the pie chart representing hormones enzymes and other proteins.
 View Solution
The pie chart graphs shows the number of seats that each party has in the lower house of the parliament. Study the diagram and answer the following questions.
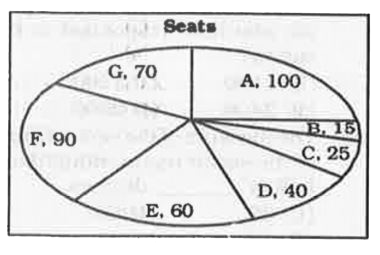
The measure of the central angle of the sector representing number of seats of party F is ____ degrees.View Solution


