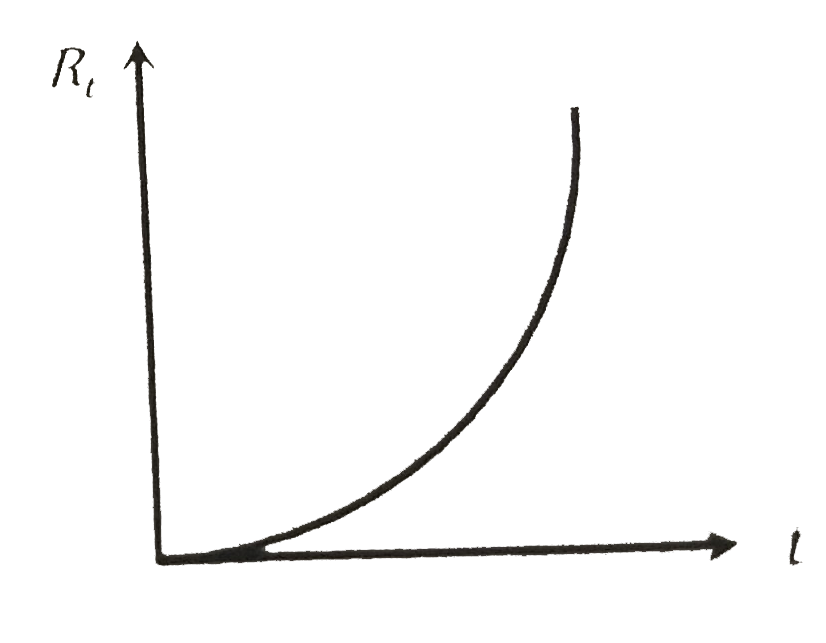
Show graphically how resistance of a piece of carbon varies with temperature
To show graphically how the resistance of a piece of carbon varies with temperature, we can follow these steps:
Step 1: Understand the Relationship
The resistance R of a piece of carbon is inversely proportional to temperature T. This means that as the temperature increases, the resistance decreases, and vice versa.
Step 2: Define the Variables
- Let R represent the resistance of the carbon.
- Let T represent the temperature.
Step 3: Write the Mathematical Relationship
From the relationship, we can express it mathematically as:
R∝1T
or
R=kT
where k is a constant.
Step 4: Create a Table of Values
To visualize this relationship, we can create a table of values for different temperatures and their corresponding resistances. For example:
| Temperature (T) | Resistance (R) |
|------------------|-----------------|
| 0°C | k/0 (undefined) |
| 20°C | k/20 |
| 40°C | k/40 |
| 60°C | k/60 |
| 80°C | k/80 |
| 100°C | k/100 |
Step 5: Plot the Graph
1. On the x-axis, plot the temperature T.
2. On the y-axis, plot the resistance R.
3. As T increases, R decreases, which will create a curve that approaches the x-axis but never touches it (as resistance cannot be zero).
Step 6: Draw the Curve
The graph will show a hyperbolic curve that decreases as temperature increases, illustrating the inverse relationship between resistance and temperature for carbon.
Conclusion
The graph clearly shows that with an increase in temperature, the resistance of carbon decreases, confirming the inverse relationship.
---
The resistance R of a piece of carbon is inversely proportional to temperature T. This means that as the temperature increases, the resistance decreases, and vice versa.
- Let R represent the resistance of the carbon.
- Let T represent the temperature.
From the relationship, we can express it mathematically as:
R∝1T
or
R=kT
where k is a constant.
To visualize this relationship, we can create a table of values for different temperatures and their corresponding resistances. For example:
|------------------|-----------------|
| 0°C | k/0 (undefined) |
| 20°C | k/20 |
| 40°C | k/40 |
| 60°C | k/60 |
| 80°C | k/80 |
| 100°C | k/100 |
1. On the x-axis, plot the temperature T.
2. On the y-axis, plot the resistance R.
3. As T increases, R decreases, which will create a curve that approaches the x-axis but never touches it (as resistance cannot be zero).
The graph will show a hyperbolic curve that decreases as temperature increases, illustrating the inverse relationship between resistance and temperature for carbon.
The graph clearly shows that with an increase in temperature, the resistance of carbon decreases, confirming the inverse relationship.
Topper's Solved these Questions
- SAMPLE PAPER 2022BOOK - ICSE MODEL PAPERCHAPTER - SAMPLE PAPER 2022EXERCISE - PART II (SECTION A)
12 Videos
- SAMPLE PAPER 2022BOOK - ICSE MODEL PAPERCHAPTER - SAMPLE PAPER 2022EXERCISE - PART II (SECTION B)
8 Videos
- SAMPLE PAPER 2022BOOK - ICSE MODEL PAPERCHAPTER - SAMPLE PAPER 2022EXERCISE - PART II (SECTION C)
8 Videos
Similar Questions
Show graphically how electric resistance of a piece of Silicon or Germanium varies when its temperature is varied.
View SolutionHow does the speed of sound in air vary with temperature ?
View SolutionThe specific heat of an ideal gas varies with temperature T as
View SolutionFind the resistance of the following carbon resistor.

View SolutionA carbon and an aluminium wire are connected in series. If the combination has equivalent resistance of(90Ω) at (0∘C), the value of the resistance of each wire at(0∘C) so that the resistance of combination does not change with temperature is
View SolutionFind the resistance of following carbon resistor.

View SolutionFind the resistance of the following carbon resistor

View SolutionResistance increases with increases in temperature for
View SolutionExplain graphically how the rate of a reaction changes with every 10∘C rise in temperature.
View SolutionThe resistance R of a conductor varies with temperature t as shown in the figure. If the variation is represented by Rt=R0[1+αt+βt2], then

View Solution
