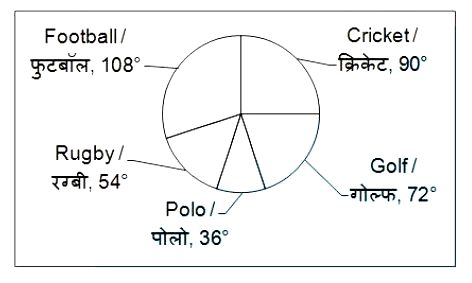
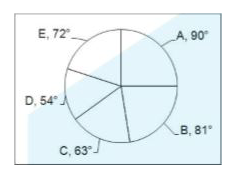
The pie chart given below shorts the distribution of students who like the given 5 sports. The total number of students is 960.
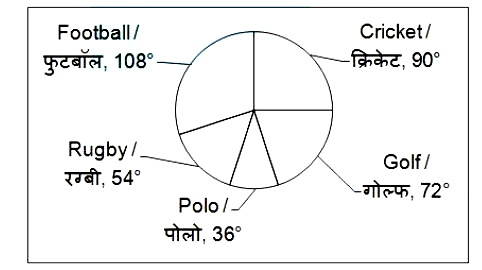
The number of students who like Golf is how much percent more than the number of students who like Rugby?
25
50
33.33
66.66
The correct Answer is:C
Step by step video, text & image solution for The pie chart given below shorts the distribution of students who like the given 5 sports. The total number of students is 960. The number of students who like Golf is how much percent more than the number of students who like Rugby? by Maths experts to help you in doubts & scoring excellent marks in Class 14 exams.
Similar Questions
The pie chart given below shows the number of students in 6 different sections. The total number of students is 1800.
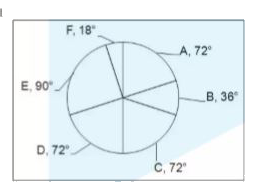
What is the total number of students in section E, C and F?View SolutionThe pie chart given below sows the number of students in 6 different sections. The total number of students is 1800.
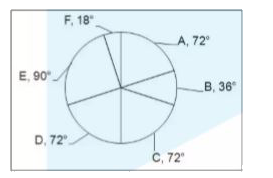
What is the average number of students in section A, B and F?View Solution
Knowledge Check
- Question 1 - Select One
the pie chart given below shows the distribution of students who like the given 5 sports. . The total number of students is 960.
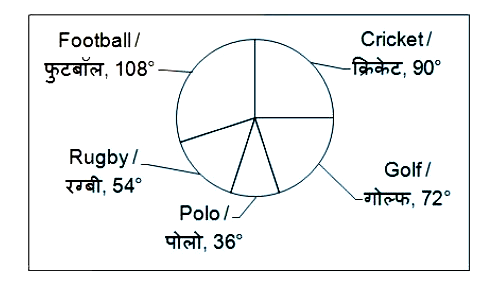
What is the average number of students who like Golf and Cricket?A240B432C192D216 - Question 2 - Select One
The pie chart given below shows the distribution of students who like the given 5 sports. The total number of students is 960.
The total number of students who like these 2 sports is equal to the number of students who like Cricket. Which are these 2 sports?AGolf and FootballBRugby and PoloCCricket and GolfDPolo and Gol - Question 3 - Select One
The pie chart given below shows the distribution of students who like the given 5 sports. The total number of students is 960.
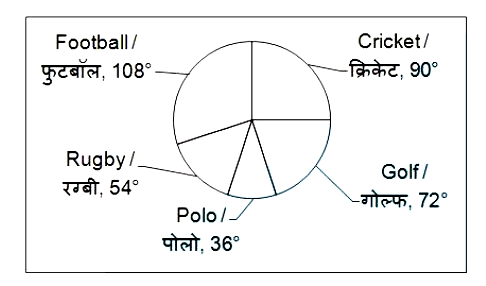
What is the difference between the number of students who like Cricket and those who like Golf?A72B50C48D90
The pie chart given below shows the number of students in 6 different sections. The total number of students is 1800.
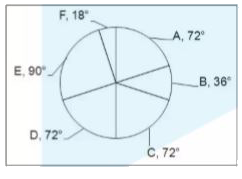
What is the difference between the number of students in section F to the number of students in section C?View SolutionThe pie chart given below shows the number of students in 6 different sections. The total number of students is 1800.
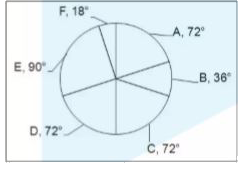
What is the ratio of number of students in section D to the number of students in section F and B?View SolutionThe pie chart given below shows the number of students in 5 sections .The number of students is 7200.
What is the average number of students of the 2 smallest sections?
 View Solution
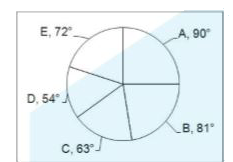
The pie chart given below shows the number of students in 5 sections .The number of students is 7200.
The number of students in section A is what percent of that of section B?
 View Solution
The pie chart given below shows the number of students in 5 sections .The number of students is 7200.
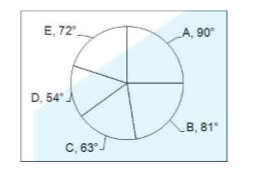
What is the total number of students in section E and section B?View Solution

