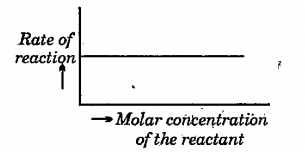
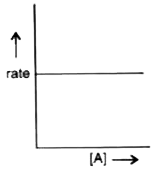
The following graph is obtained when we plot rate of reaction verus molar concertration of the reactant. What is the order of the reaction that is evident from the graph?
 Solution in Odia
Step by step video & image solution for The following graph is obtained when we plot rate of reaction verus molar concertration of the reactant. What is the order of the reaction that is evident from the graph? by Chemistry experts to help you in doubts & scoring excellent marks in Class 12 exams.
Updated on:21/07/2023Topper's Solved these Questions
Similar Questions
A transition metal ion has electronic configuration [Ar]3d7 in its dipositive oxidation state. Its atomic number is
View SolutionThe structure of NaCl is
View SolutionThe rate of a reaction is doubled when the concentration of reactant is doubled. What is the order of the reaction ?
View SolutionWhat will be the nature of the graph showing the concentration of the reactant and time of a first order reaction ?
View SolutionFor a reaction , the graph obtained by plotting t1/2 of the reaction against initial concentrations [A]0 of the reactant is a straight line passing through the origin . The order of the reaction is -
View Solutionplot a graph of reaction -rate vs concentration of the reactant for a fist order reaction.
View SolutionIn a first order reaction , on plotting a graph between t_(1//2) and concentration of reactant
View SolutionExplain with an example, what is a pseudo first order raction ? The graphs (A and B) given below are plots of rate of reaction Vs concentration of the reactant. Predict the order from the graphs.
View SolutionFor Zero Order Reaction, Plot of Concentration of Reactant v/s time is a straight line graph with
View SolutionFor a reaction the graph of the rate of the reaction against molar concentration of the reactant is as shown :

What is the order of the reaction ?
View SolutionFollowing graph is obtained for four different reactions On the basis of above graph, correct increasing order of reaction is
View SolutionK represents the rate constant of a reaction when logK is plotted against 1/T (T= temperature) the graph obtained is a
View SolutionFor a 1st order reaction when rate of reaction is plotted conc. of reactant a straight line is obtained whose slope is 2.5. What is its rate constant.
View SolutionPlot a graph showing variation in the concentration of reactants against time for a zero order reaction.
View SolutionWhen rate of a 1st order reaction is plotted Vs. concentration of the reactant a straight line is obtained, whose slope is equal to____
View SolutionIn a first order reaction , on plotting a graph between t1/2 and concentration of reactant
View Solution
