Read the following graph carefully and answer the questions given below.
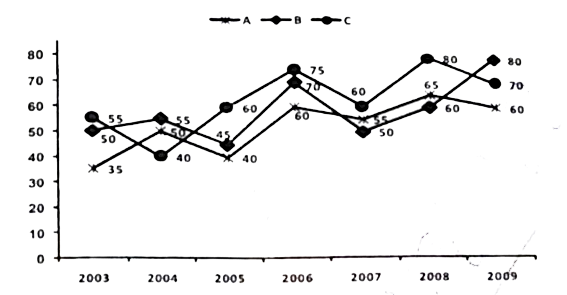
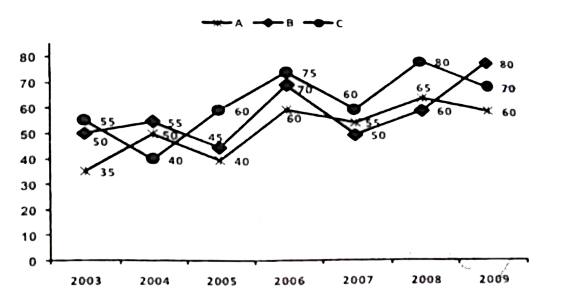
Production of sugar in three different factories over years (in thousand tonnes)
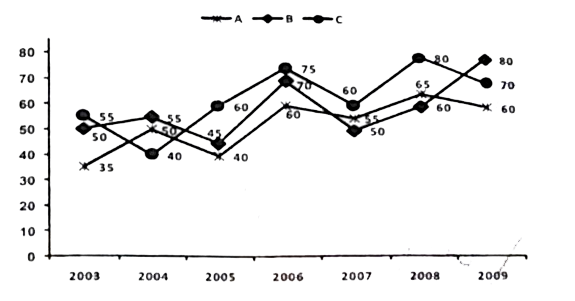
The average production of company A is approximately what percent of average production of company C ?
86
83
77
90
The correct Answer is:B
Step by step video, text & image solution for Read the following graph carefully and answer the questions given below. Production of sugar in three different factories over years (in thousand tonnes) The average production of company A is approximately what percent of average production of company C ? by Maths experts to help you in doubts & scoring excellent marks in Class 14 exams.
Topper's Solved these Questions
Similar Questions
Read the following graph carfully and answer the questions given below. Production of bulbs by different companies in three years (In lakhs)
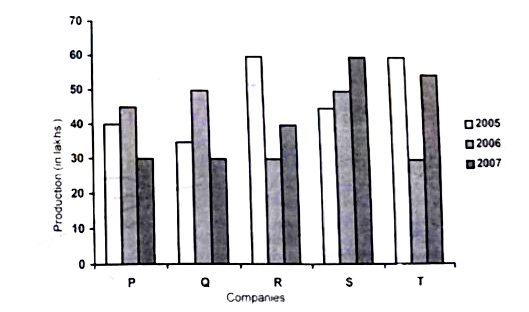
The average production of which company was maximum?View SolutionRead the following graph carfully and answer the questions given below. Production of bulbs by different companies in three years (In lakhs)
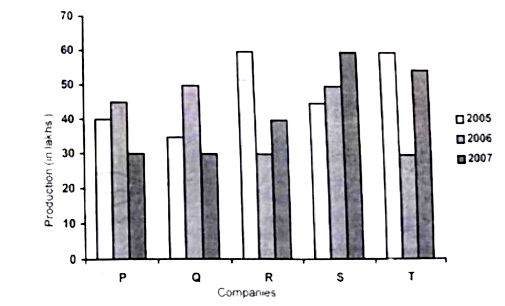
The total production of company P and Q in the year 2006 is approximately what percent of the total production of all companies in the year 2007 ?View Solution
Knowledge Check
- Question 1 - Select One
Read the following graph carefully and answer the questions given below.
Production of sugar in three different factories over years (in thousand tonnes)
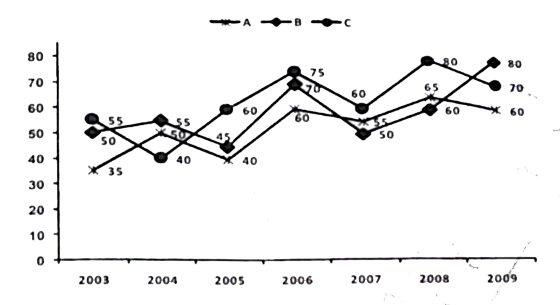
What is the average production of company C in all the years ?AA) 5427 thousand tonnesBB) 5217 thousand tonnesCC) 5827 thousand tonnesDD) none of these - Question 2 - Select One
Read the following graph carefully and answer the questions given below.
Production of sugar in three different factories over years (in thousand tonnes)
The total production of company B in 2004 and 2006 is what percent of total production of company C in 2006 and 2008 ?A30B98C56D81 - Question 3 - Select One
Read the following graph carefully and answer the questions given below.
Production of sugar in three different factories over years (in thousand tonnes)
What was the percentage decrease in production of company C in 2007 from previous year ?AA) 20BB) 22CC) 18DD) 15
Read the following graph carfully and answer the questions given below. Production of bulbs by different companies in three years (In lakhs)
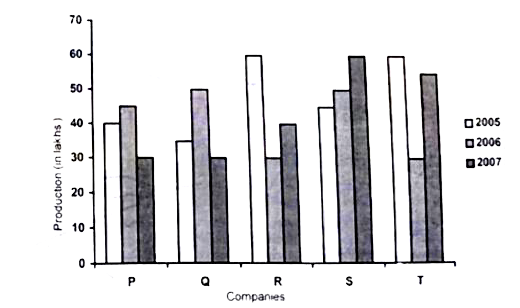
What is the ratio of average production of company Q to the average production of company T in all the given years?View SolutionRead the following graph carfully and answer the questions given below. Production of bulbs by different companies in three years (In lakhs)
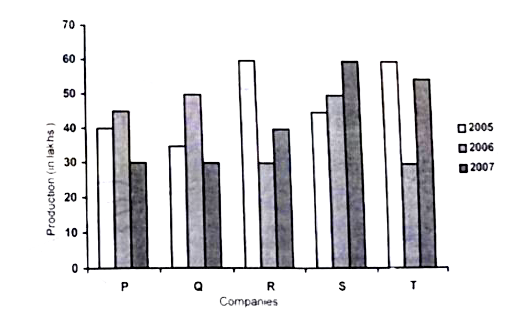
What was the total production of all companies together in the year 2005 ?View SolutionRead the following graph carfully and answer the questions given below. Production of bulbs by different companies in three years (In lakhs)
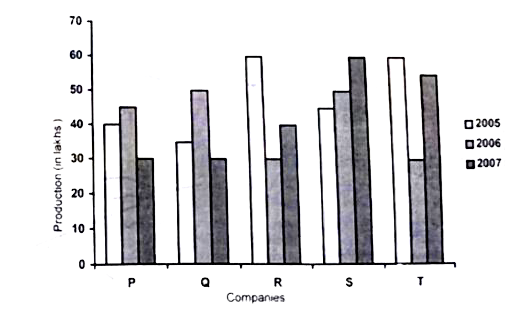
What was the approximate percent decrease in production of company P from 2006 to 2007 ?View SolutionRead the following graph carefully and answer the questions given below.
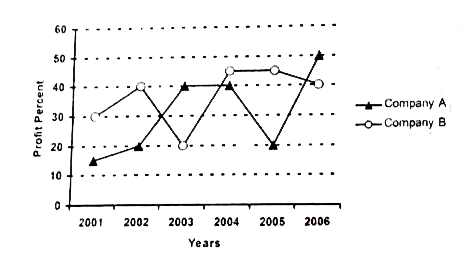
In which year the average of the profit percent of the both companies was the maximum ?View SolutionRead the following graph carefully and answer the questions given below.
Production of sugar in three different factories over years (in thousand tonnes)
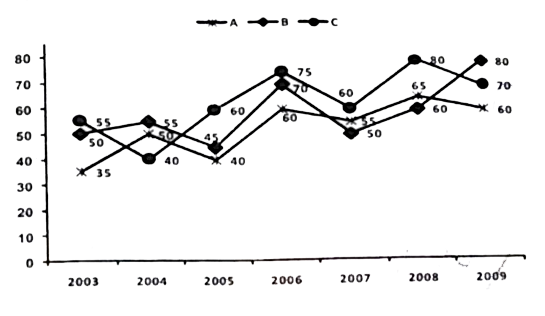
In which year was the percentage increase/decrease in production of company B maximum ?View Solution

