Study the following graph and answer these questions given below:-
Tea in India (in million kg.)
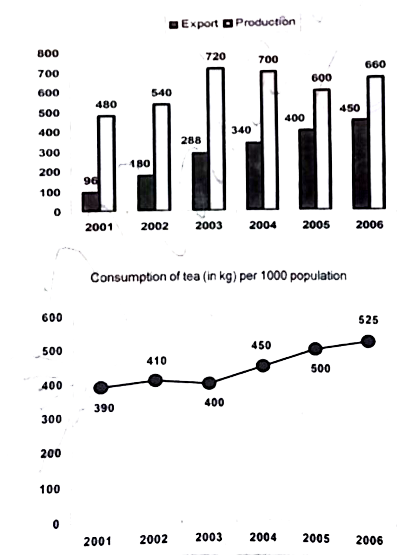
If the area under tea production was less by 10% in 2004 than in 2003, then the approximate rate of increase in productivity of tea in 2004 was
97.22
3
35
Cannot be determined
The correct Answer is:D
Topper's Solved these Questions
Similar Questions
Study the following graph and answer the questions given below it.
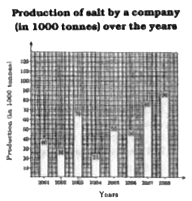
What was the percentage decline in the product of salt from 2003 to 2004 ?
View SolutionStudy the following graph and answer the questions given below it.
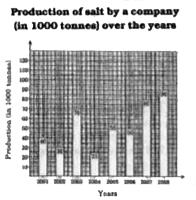
In how many of the given years was the production of salt more than the average production of the given years?
View Solution
Knowledge Check
Study the following graph and answer these questions given below:-
Tea in India (in million kg.)
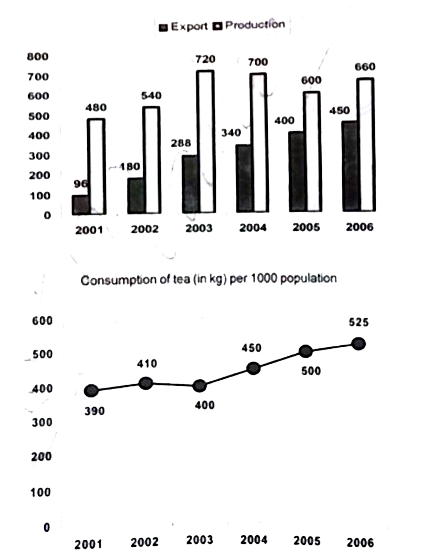
What was approximately the average production during the period?A650 millionB625 millionC600 millionD616 millionStudy the following graph and answer these questions given below:-
Tea in India (in million kg.)
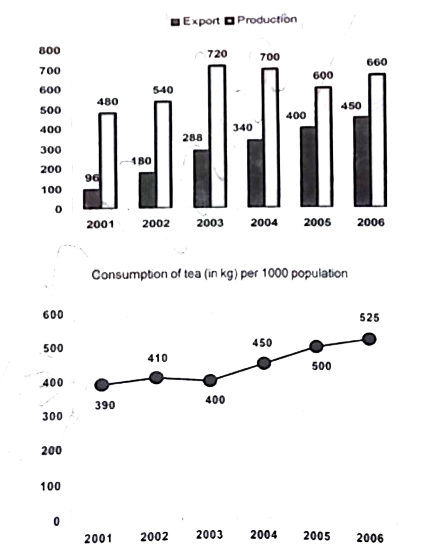
In which year we had maximum quantity of tea for domestic consumption?AA) 2004BB) 2001CC) 2003DD) 2006Study the following graph and answer these questions given below:-
Tea in India (in million kg.)
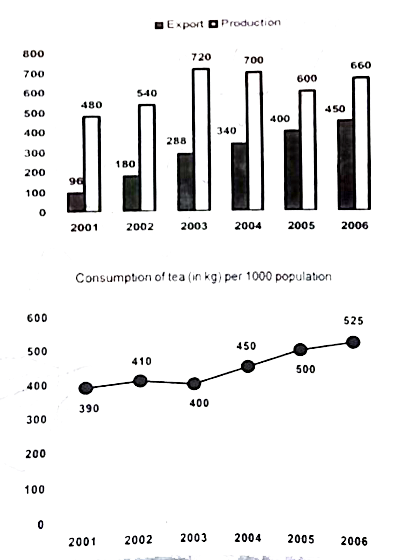
Which year shows the maximum percentage of export with respect to production?A2002B2003C2006D2005
Study the following graph and answer the questions given below it.
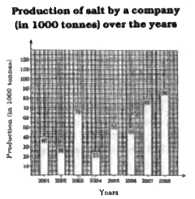
What was the percentage increase in production of salt in 2008 compared to that of 2001 ?
View SolutionStudy the following graph and answer these questions given below:-
Tea in India (in million kg.)
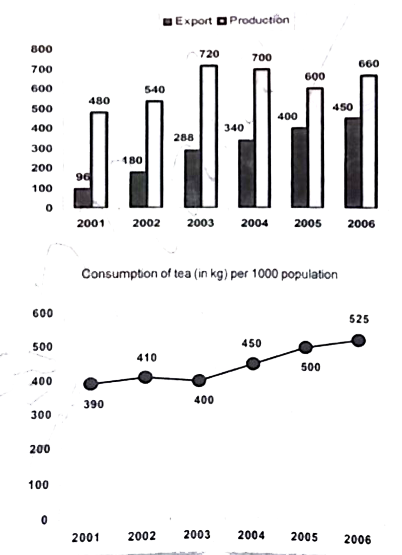
In which year was there minimum percentage of export with respect to production?
View SolutionStudy the following graph and answer these questions given below:-
Tea in India (in million kg.)
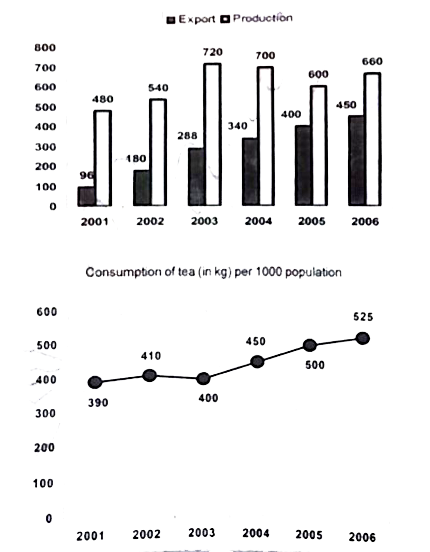
What was approximately the average quantity of tea available for domestic consumption during the period? (Two place of decimal)
View SolutionStudy the following graph and answer the questions given below -----
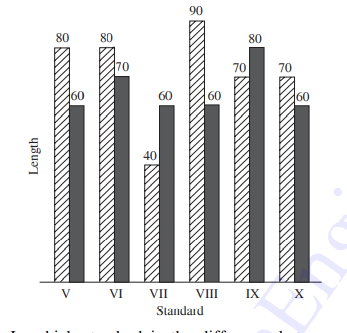
In which standard is the result of boys less than the average result of the girls ?
View SolutionStudy the following graph carefully and answer the questions given below
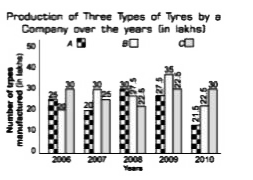
In which of the following years, was the percentage production of B type to C type the maximum?
View Solution
