Study the following graph and answer the following questions :-
Following graph shows the actual & target productin of a companry over the period (in thousand tonnes)
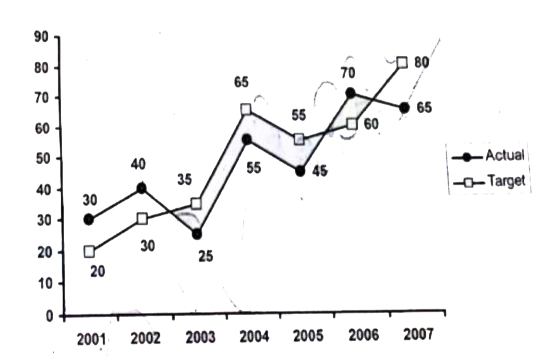
What will be the ratio between above and below the average target production ?
The correct Answer is:D
Topper's Solved these Questions
Similar Questions
Study the following graph and answer the questions given below it.
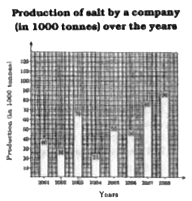
What was the percentage decline in the product of salt from 2003 to 2004 ?
View SolutionStudy the following graph and answer the question based on the graph.
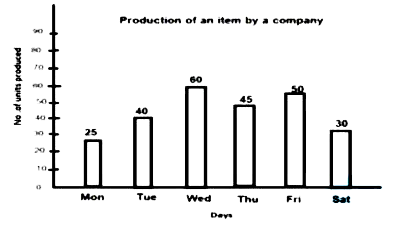
What was the percentage decline in the production from Friday to Saturday?
View Solution
Knowledge Check
Study the following graph and answer the following questions :-
Following graph shows the actual & target productin of a companry over the period (in thousand tonnes)
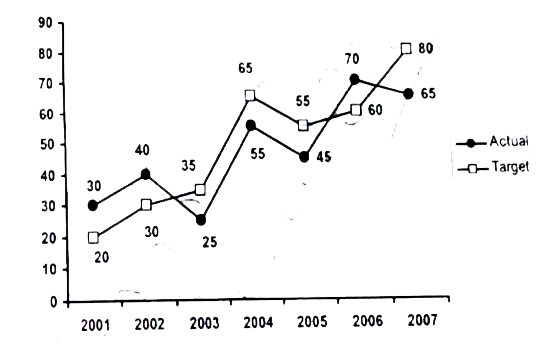
What is the difference between the total actual production and total target productin in all the years taken together ?A15000 tonnesB12000 tonnesC9000 tonnesD20000 tonnesStudy the following graph and answer the following questions :-
Following graph shows the actual & target productin of a companry over the period (in thousand tonnes)
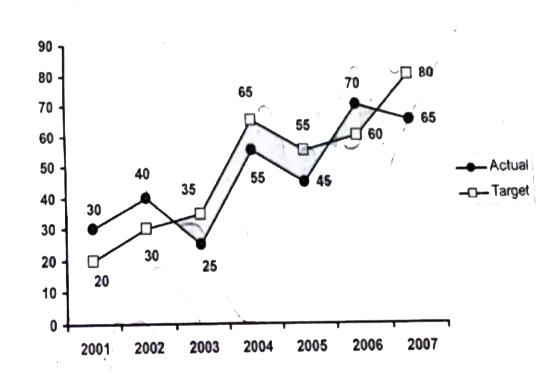
The actual production in 2005 is what percent of the target production of 2007 ?A44%B56.25%C43.75%D37.5%Study the following graph and answer the following questions :-
Following graph shows the actual & target productin of a companry over the period (in thousand tonnes)
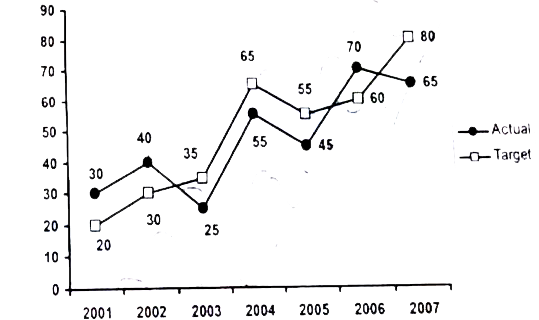
In which of the following years the percentage production of actual with respect to target is the maximum ?A2001B2005C2002D2007
Study the following graph and answer the question.
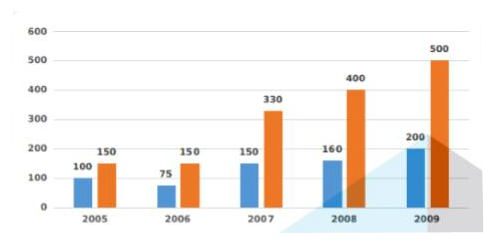
In which year was the value per tonne the minimum?
View SolutionStudy the following graph and answer the following questions :-
Following graph shows the actual & target productin of a companry over the period (in thousand tonnes)
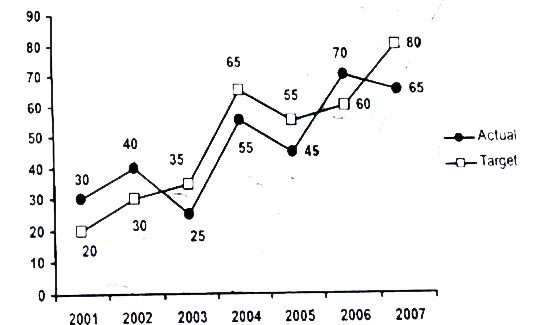
the target production in the year 2001, 2003 and 2005 together is what percent of acutal production of 2002, 2004 and 2006 together ?
View SolutionStudy the following bar graph and answer the question that follows.
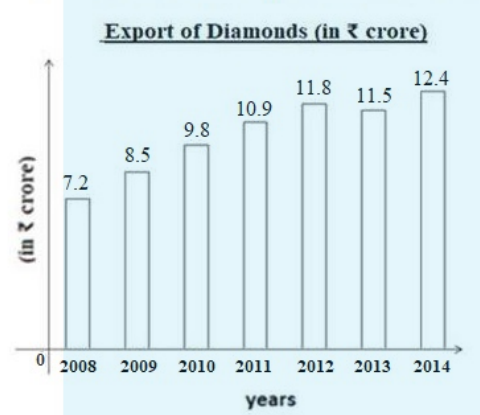
In which year was the maximin percentage increase in diamonds exports compared to the previous year?
View SolutionStudy the graph and answer the following questions-
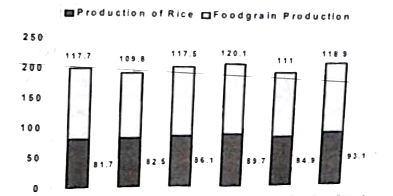
Over the given years what is average production of rice?
View SolutionStudy the following graph carefully and answer the questions that follow
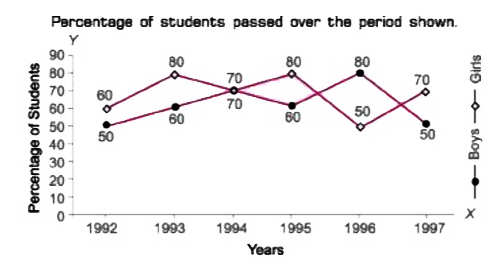
What is the over all percentage of failed boys over the period shown ?
View Solution
