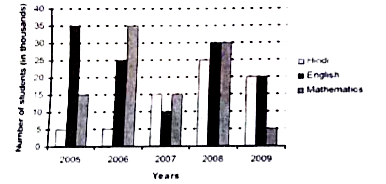
Study the following graph and answer the questions given below :
No. of students (in thousands) who opted for three different specializations during the given five years in a University

What is the total number of students who opted for Hindi and who opted for Mathematics in the years 2006, 2007 and 2009 together ?
97000
93000
85000
95000
The correct Answer is:C
Step by step video, text & image solution for Study the following graph and answer the questions given below : No. of students (in thousands) who opted for three different specializations during the given five years in a University What is the total number of students who opted for Hindi and who opted for Mathematics in the years 2006, 2007 and 2009 together ? by Maths experts to help you in doubts & scoring excellent marks in Class 14 exams.
Updated on:21/07/2023Topper's Solved these Questions
Similar Questions
What value will come in place of question mark (?) in the questions given below?
123×14.5×114=?(3.4)2
View SolutionWhat will come in place of question mark (?) in the following questions ?
[(85)2+17×34]+68=?
View SolutionOut of 1800 students in a school, 750 opted basketball, 800 opted cricket and remaining opted table tennis. If a student can opt only one game, find the ratio of(a) Number of students who opted basketball to the number of students who opted table tennis.(b) Number of students who opted cricket to the number of students optingbasketball.(c) Number of students who opted basketball to the total number of students.
View SolutionIn an university,out of 100 students,16 opted mathematics only,24 opted physics only,30 opted for chemisty only and 8 opted chemistry and mathematics,14 opted physics and chemistry,4 opted mathematics and physics, and 48 opted chemistry.By drawing Venn diagram,find the number of students who
View SolutionThere are 175 students in a class, out of which 100 students opt Maths, 70 opt Physics and, 23 opt Physics and Chemisty, 28 opt Chemistry and Maths and 18 opt of all three subjects. Now find each of the following :
No. of students who opt why only Maths
(ii) No. of students who opt only Physics
(iii) No. of students who opt only Chemistry
(iv) No. of students who opt Physics and Chemisty but not Maths
(v) No. of students who opt Maths and Physics but not Chemistry
(vi) No. of students who opt only one subject
(viii) No. of students who opt atleast one subject
(viii) No. of student who do not opt any subject.
View SolutionMatch the following Column A to Column B

View SolutionThe inequation represented by the graph given below is :
View SolutionThe inequation that best describes the graph given below is _________
View SolutionThe inequation that best describes the following graph is _________
View SolutionOut of 1800 students in a school, 750 opted basketball, 800 opted cricket and remaining opted table tennis. If a student can opt only one game, find the ratio of(a) Number of students who opted basketball to the number of students who opted table tennis.(b) Number of students who opted cricket to the number of students optingbasketball.(c) Number of students who opted basketball to the total number of students.
View SolutionIn a class of 35 students, 18 students opt Maths, 12 students opt Maths but not Science. Find the number of students who opt both subjects. Also find the number of students who opt Science but not Maths. It is given that each student opt atleast one subject.
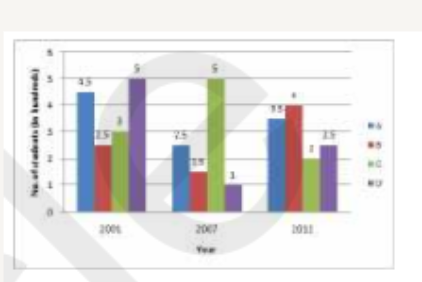
View SolutionThe following bar graph shows the number of students (in hundreds) who have opted for different courses A, B, C and D in 3 years in a college. Study the graph and answer the question.
 What is the ratio of the number of students who were admitted to course A in the year 2007 to that
of students who were admitted to course C in the year 2012?
View SolutionStudy the following graph carefully What is the average number of students who opted for course A in the years 2010, 2011 and 2012?
View Solutionstudy the following diagram What is the ratio between the number of students who opted for Cricket and Volleyball in the year 2012 and 2013 together?
View SolutionOut of a total of 135 students opting for Biology, Mathematics or both, the total number of girls in the class is 80% of the total number of boys. The number of girls who opted for only Biology is 45% of the total number of girls and the number of girls who opted for Biology is 75% of the total number of girls. The number of students who opted for Mathematics only is 40% of the total number of students and a total of 25 students opted for both Biology and Mathematics. What is the number of people who opted for Biology only?
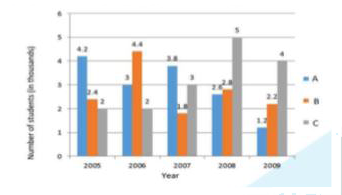
View SolutionThe following graph below shows the number of students (in thousands) who were admitted to three different courses in 5 years in a university. Study the graph and answer the question.

What is the ratio of the number of students who were admitted to course A in the year 2007 to that of students who were admitted to course C in the year 2009?
View Solution
