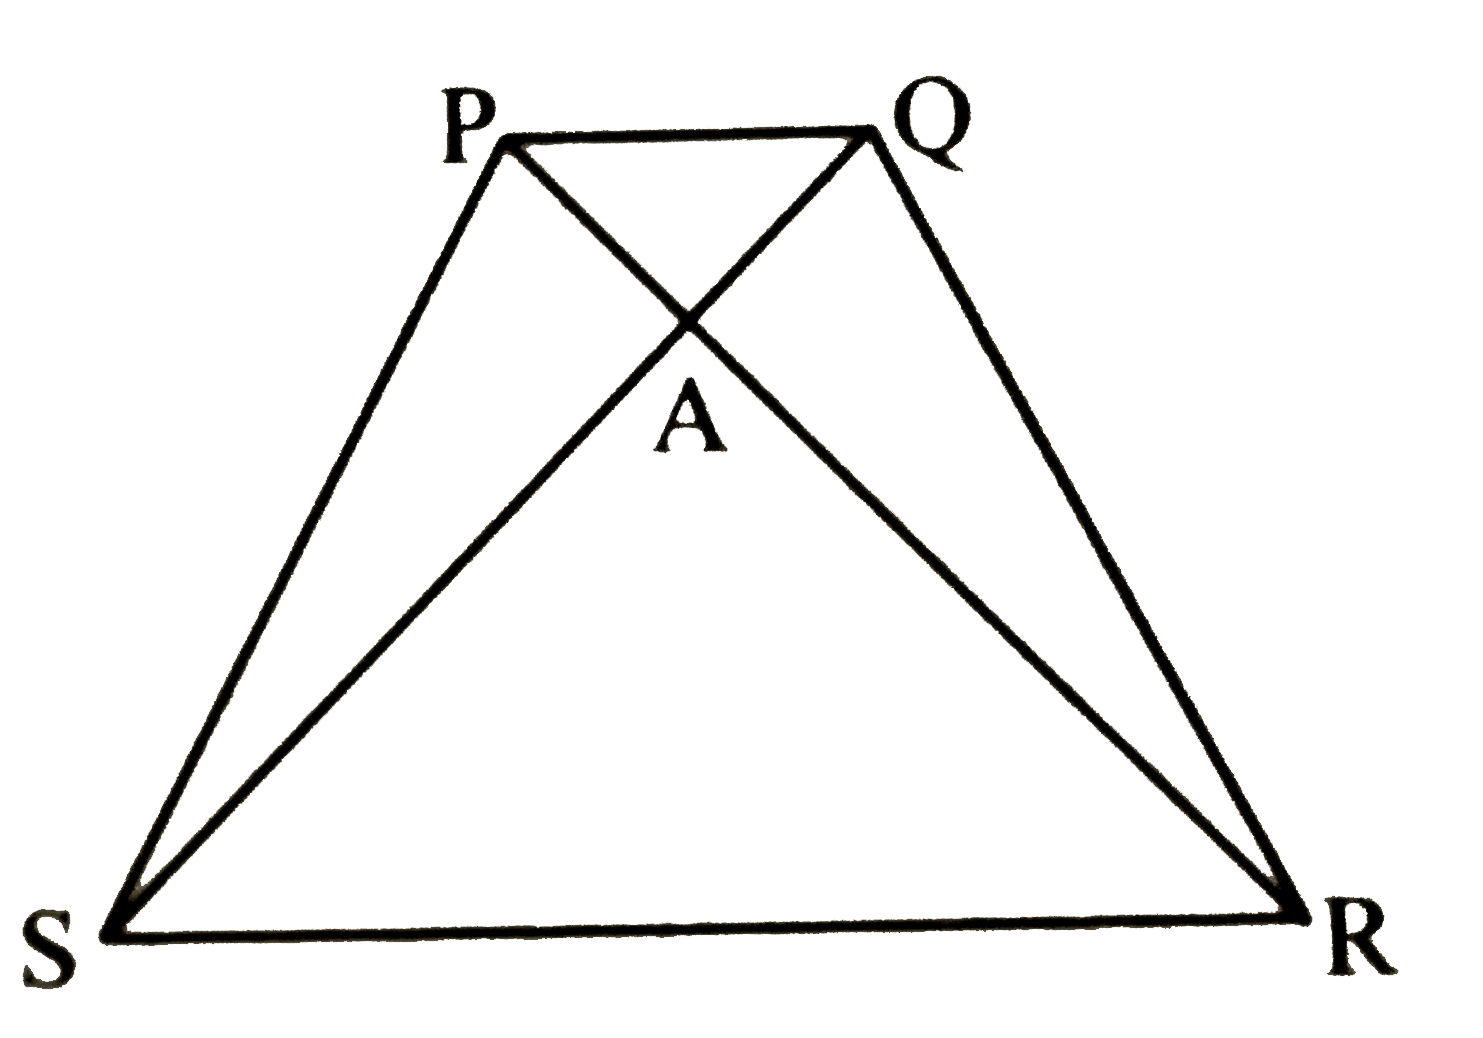
Given : In trapezium PQRS, side PQSR, AR = 5 AP, AS = 5 AQ, then prove that SR=5 PQ.
 Solution in Marathi
Step by step video & image solution for Given : In trapezium PQRS, side PQabs()SR, AR = 5 AP, AS = 5 AQ, then prove that SR=5 PQ. by Maths experts to help you in doubts & scoring excellent marks in Class 10 exams.
Updated on:21/07/2023Topper's Solved these Questions
- SIMILARITY Book:BAL BHARTIChapter:SIMILARITY Exercise:PRACTICE SET 1.4
Explore 6 Videos
- SIMILARITY Book:BAL BHARTIChapter:SIMILARITY Exercise:PROBLEM SET 1
Explore 12 Videos
- SIMILARITY Book:BAL BHARTIChapter:SIMILARITY Exercise:PRACTICE SET 1.2
Explore 5 Videos
- QUADRATIC EQUATIONSBook:BAL BHARTIChapter:QUADRATIC EQUATIONSExercise:Problem Set - 2
Explore 27 Videos
- TRIGONOMETRYBook:BAL BHARTIChapter:TRIGONOMETRYExercise:Problem set 6
Explore 18 Videos
Similar Questions
Ratio of corresponding sides of two similar triangles is 3:5, then find ratio of their areas.
View SolutionIn ΔABCandΔPQR, in a one to one correspondence.
ABQR=BCPR=CAPQ, then

View SolutionIn ΔMNP, NQ is a biscetor of ∠N. If MN = 5, PN = 7, MQ = 2.5, then find QP.
View SolutionWhich of the following equation is quadratic?
(i) x2+2x+11=0.
View SolutionIf sinθ = 11/61 find the values of cosθ using trigonometric identity.
View SolutionDetermine the point of symmetry of a regular hexagon.
View SolutionDtermine the images of the following figure about the given line :
View SolutionMatch the following Column A to Column B

View SolutionMatch the following Column A to Column B

View SolutionMatch the following Column A to Column B

View SolutionFind the area of the figure given below.

View SolutionIn the figure given below, PQRS is a square of side 14 cm and two semicircles are drawn inside of it with PQ and SR as diameters. Find the area of the shaded region in the figure.
ltimg src="https://d10lpgp6xz60nq.cloudfront.net/physics_images/PS_MATH_VII_C06_E03_021_Q01.png" width="80%"gt
View SolutionThe inequation represented by the graph given below is :
View SolutionThe inequation that best describes the graph given below is _________
View SolutionThe inequation that best describes the following graph is _________
View SolutionWhich inequations represent the shaded region in the given figure
View Solution