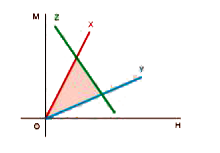
The following figure shows the variation of intensity of magnetisation with the applied magnetic field intensity for three magnetic materials X, Y and Z. Identify the materials X,Y and Z.

The slope of M-H graph measures the magnetic susceptibility, which is χm=MH
Material X: Slope is positive and larger value. So, it is a ferromagnetic material.
Material Y: Slope is positive and lesser value than X. So, it could be a paramagnetic material.
Material Z: Slope is negative and hence, it is a diamagnetic material.
Topper's Solved these Questions
- MAGNETISM AND MAGNETIC EFFECTS OF ELECTRIC CURRENTBOOK - NCERT TAMILCHAPTER - MAGNETISM AND MAGNETIC EFFECTS OF ELECTRIC CURRENTEXERCISE - EVALUATION (I Multiple choice questions)
15 Videos
- MAGNETISM AND MAGNETIC EFFECTS OF ELECTRIC CURRENTBOOK - NCERT TAMILCHAPTER - MAGNETISM AND MAGNETIC EFFECTS OF ELECTRIC CURRENTEXERCISE - EVALUATION (IV. Numerical problems)
10 Videos
- ELECTROSTATICSBOOK - NCERT TAMILCHAPTER - ELECTROSTATICSEXERCISE - Exercises
23 Videos
- MAGNETISM AND MATTERBOOK - NCERT TAMILCHAPTER - MAGNETISM AND MATTEREXERCISE - Additional Exercises
19 Videos
Similar Questions
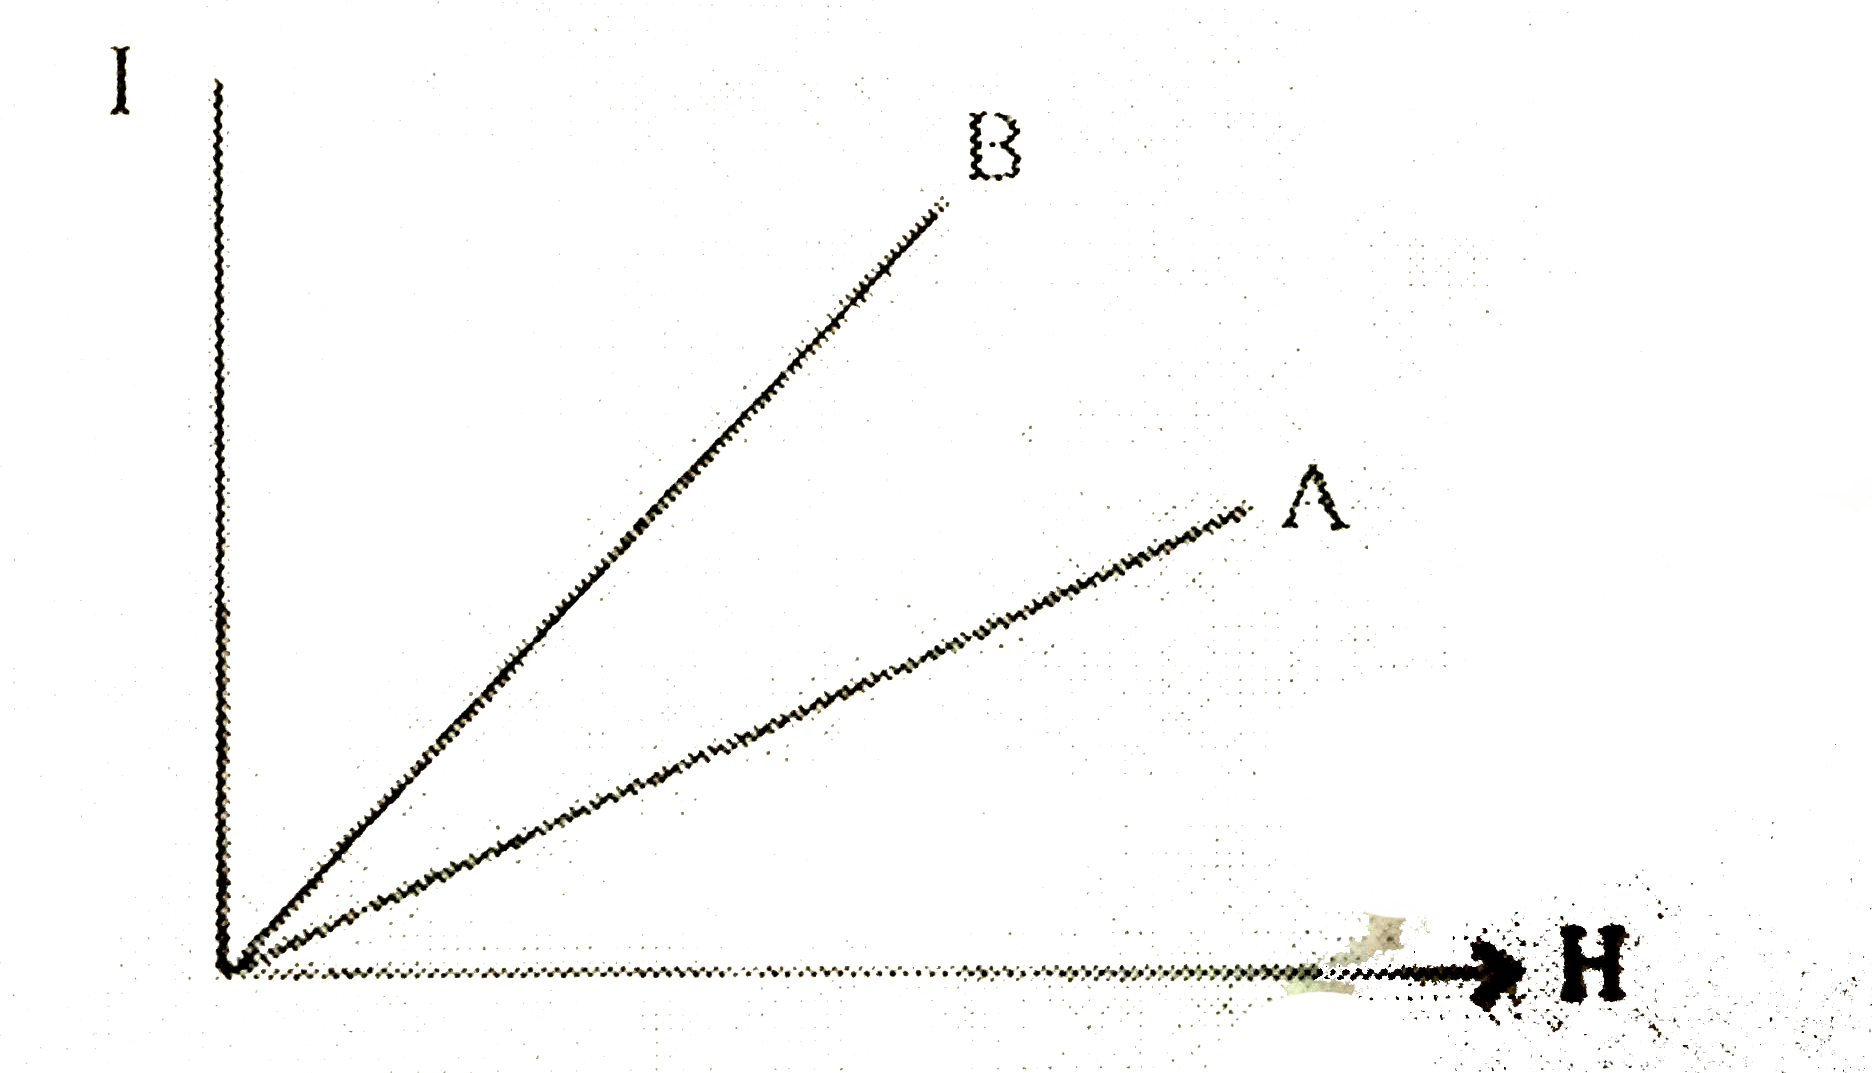
The following figure shows the variation of intensity of magnetisation versus the applied magnetic field intensity, H, for two magnetic materials A and B :
(a) Identify the materials A and B.
(b) Why does the material B, have a larger susceptibility than A, for a given field at constant temperature?

View SolutionThe following figure shows the variation of intensity of magnetisation versus the applied magnetic field intensity, H, for two magnetic materials A and B :
(a) Identify the materials A and B.
(b) Why does the material B, have a larger susceptibility than A, for a given field at constant temperature?

View Solution
Knowledge Check
The ratio of magnetisation I to the magnetic field intensity H is
ASusceptibilityBPermeabilityCPermittivityDAll of thoseA material produces a magnetic field which oppose the applied magnetic field, then it is
AdaimagneticBpara magneticCelectro magneticDferro magnetic
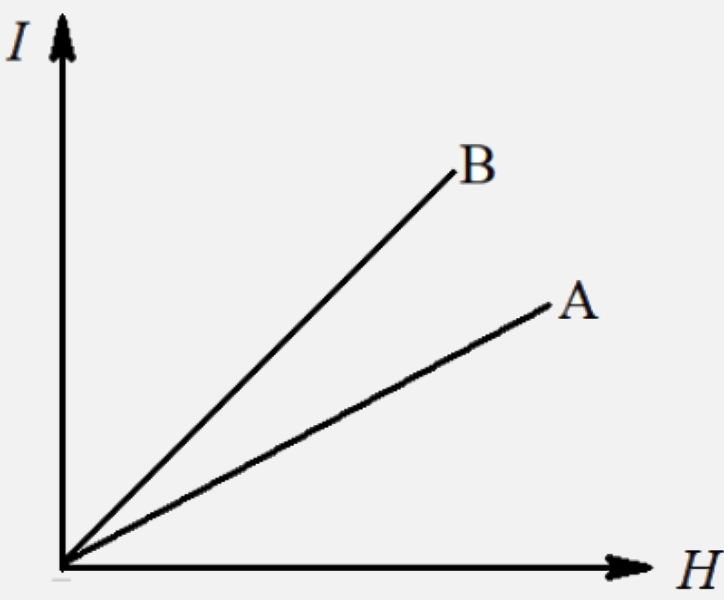
The following figure shows the variation of intensity of magnetisation I versus the applied magnetic field intensity H, for two magnetic materials A and B

Which of the material have a larger susceptibility for a given field at constant temperature?
View SolutionThe following figure shows the variation of intensity of magnetisation I versus the applied magnetic field intensity H, for two magnetic materials A and B

Which of the material have a larger susceptibility for a given field at constant temperature?
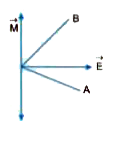
View SolutionFigure shows the variation of intensity of magnetisation →M versus the applied magnetic field intensity →H for two materials A and B:
(a) Identify the materials A and B.
(b) Why does the material B, have a larger susceptibility than A for a given field at constant temperature ?

View SolutionThe ratio of magnetisation I to the magnetic field intensity H is
View SolutionHow does the intensity of magnetization depend on an applied magnetic field?
View SolutionThe intensity of magnetization of the magnetic fields graph for a diamagnetic material is best represented by.
View Solution
