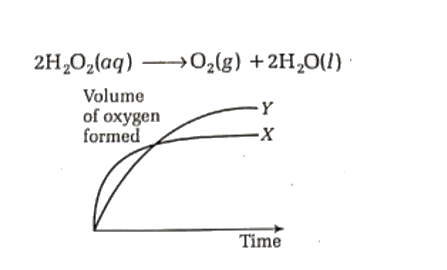
Curve X on the graph below shows the volume of oxygen formed during the catalytic decomposition of a 1.0 mol dm−3 solution of hydrogen peroxide.

Which change would produce the curve Y?
Adding water
Adding some 0.1 mol dm−3 hydrogen peroxide solution
Using a different catalyst
Lowering the temperature
The correct Answer is:b
Similar Questions
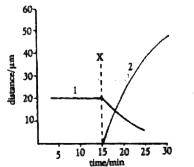
The graph below illustrates the behaviour of the chromosomes during one mitotic cell division.

Which one of the following correctly indicates the changes illustrated by curves 1 and 2, and the stage of mitosis which is commencing at X?.

View SolutionWhat is the mass of hydrogen peroxide present in 1 litre of a 2M solution ? Calculate the volume of oxygen at S.T.P. liberated upon the complete decomposition at 100 cm3 of the above solution.
View Solution
Knowledge Check
The volume of oxygen evolved at STP by decomposition of 0.68g '20 volume ' hydrogen peroxide solution is
A2.24mLB22.4mLC224mLD2240mLThe volume of oxygen evolved at STP by decomposition of 0.68g '20 volume ' hydrogen peroxide solution is
A2.24 mlB22.4 mlC224 mlD240 mlThe volume of oxygen evolved at STP by decomposition of 0.68g '20 volume ' hydrogen peroxide solution is
A2.24 mlB22.4 mlC224 mlD240 ml
What is the mass of hydrogen peroxide present in 1 litre of a 2M solution ? Calculate the volume of oxygen at S.T.P. liberated upon the complete decomposition at 100 cm3 of the above solution.
View SolutionWhat is the mass of hydrogen peroxide present in 1 litre of a 2M solution? Calculate the volume of oxygen a N.T.P. liberated upon the complelte decomposition of 100mL of the solution.
View SolutionThe volume of oxygen evolved at STP by decomposition of 0.68 g '20 volume ' hydrogen peroxide solution is
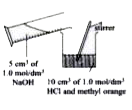
View SolutionIn an experiment , 5 cm3 of 1.0 mol/dm3 NaOH solution is gradually added to 10cm3 of 1.0mol/dm3 HCl solution containing methyl organge indicator . Which of the following changes will occur in the mixture ?

View SolutionAn experiment was carried out using the apparatus shown below:

Liquid 'X' is an aqueous solution of concentration 1 mol/dm3. Which substance would cause the bulb to glow the brightest?
View Solution
