The following figures represent students who can play, sing and dance

Which part of the figure represents students who can sing and dance ?
F
C
F and C
E and G
The correct Answer is:C
Step by step video & image solution for The following figures represent students who can play, sing and dance Which part of the figure represents students who can sing and dance ? by Maths experts to help you in doubts & scoring excellent marks in Class 10 exams.
Updated on:21/07/2023Topper's Solved these Questions
Similar Questions
These questions are based on the following diagram:
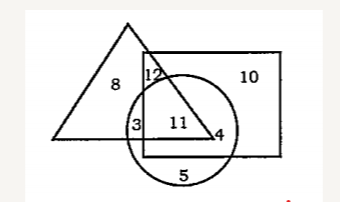
In the above figure, the Triangle represents the students who passed in Physics, the Rectangle represents the students who passed in Chemistry and the Circle represents the students who passed in Mathematics in a class.
How many students passed in Chemistry but not in Mathematics?
1) 22
2) 11
3) 18
4) 17
5)23
View SolutionThese questions are based on the following diagram:
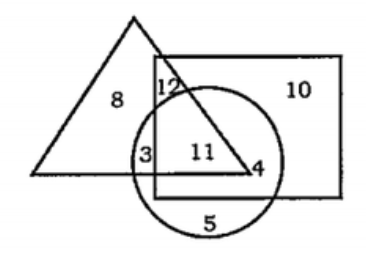
In the above figure, the Triangle represents the students who passed in Physics, the Rectangle represents the students who passed in Chemistry and the Circle represents the students who passed in Mathematics in a class.
How many students passed in Mathematics only ?
1)3
2) 5
3) 4
4) 11
5)23
View Solution
Knowledge Check
The given Venn diagram represents results of a class students:
The triangle represents students who scored 85% and above in Maths, the circle represents students who scored 85% and above in English, the rectangle represents students who scored 85% and above in Science, and the square represents students who scored 85% and above in Social Science. The numbers given in the diagram represent the number of students in that particular category.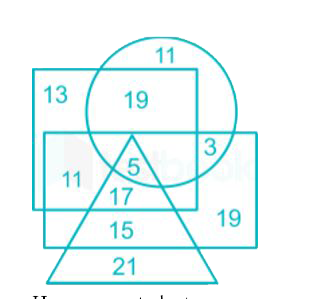
How many students scored 85% and above in all the subjects?A(A) 15B(B) 11C(C) 17D(D) 5In the following figure, the square represents Singer, circle represents Actor, and triangle represents Dancer.
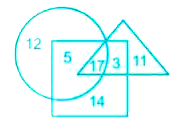
Which of the following numbers represents Actors who are singers but not Dancers?A17B5C3D22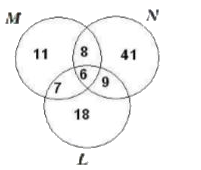
The above venn diagram represent the students who play 3 sport M,N and L in a class:
Total number of students who play game N is:A41B64C23D9
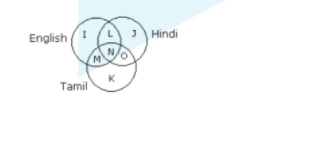
The given Venn diagram represents the students who can speak different languages. According to it, the total number of students who can speak exactly two languages is ______.
View SolutionWhich of the diagrams given below correctly represents the students who learn law and music, music and dance, law and dance and law, music and dance ?

View Solution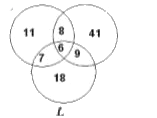
The above Venn diagram represent the students who play 3 sports M, N and L in a class. Total number of students who play game M is :
View SolutionThe diagram represents the students who are singers, dancers and poets :

Study the diagram and identify the region which represents the students who are both poets and singers but not dancers :
View SolutionIn a group of 500 students, there are 475 students who can speak Hindi and 200 can speak Bengali. What is the number of students who can speak Hindi only ?
View Solution