The Bar graph given below presents the maimum temperatuer (in ∘C) of a city for 10 different days over several months.
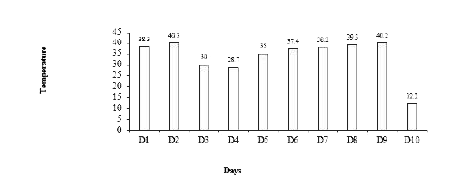
What is the average maximum temperature of the city per day for the given ten days ?
33.96∘C
32.96∘C
35.96∘C
44.96∘C
The correct Answer is:A
Step by step video, text & image solution for The Bar graph given below presents the maimum temperatuer (in ""^(@)C) of a city for 10 different days over several months. What is the average maximum temperature of the city per day for the given ten days ? by Maths experts to help you in doubts & scoring excellent marks in Class 14 exams.
Similar Questions
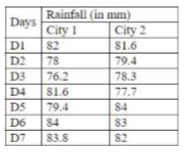
The Table given below presents the Rainfall (in mm) in two cities on different days of a week.
What is the difference (correct up to two decimal places) in average rainfall in two cities per day?
 View Solution
The Bar graph given below presents the number of males and females working in five different companies.
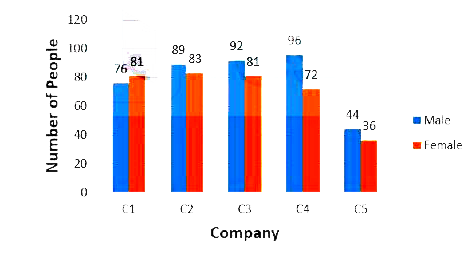
What is the average number of females working per company ?View Solution
Knowledge Check
- Question 1 - Select One
The Bar graph below presents the maximum temperature (in ∘C) of a city for 10 different days spread over serveral months.
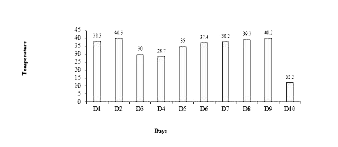
What is the difference (in degree Celsius) between the highest and the lowest recorded maximum temperature from the data given for the days ?A28.1B28.0C26.1D27.1 - Question 2 - Select One
The Bar graph given below presents the maximum (in ∘C) of a city of for 10 different days spread over several months.
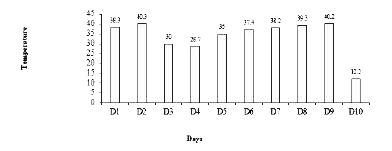
The temperature on D5 is how much percentage more than the temperature on D3 ?A16.67%B24.57%C23.01%D21.07% - Question 3 - Select One
The Bar graph given below presents the amount (volume in litres) of water in ten different mixtures.
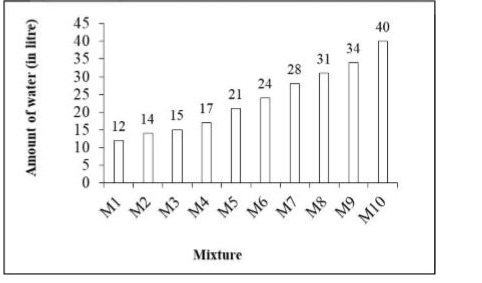
What is the averge amount of water per mixture?AA)23.6 litreBB)24.8 litreCC)24 litreDD)24.4 litre
The Bar graph given below presentes the number of cars parked on ten different days in a parking area.
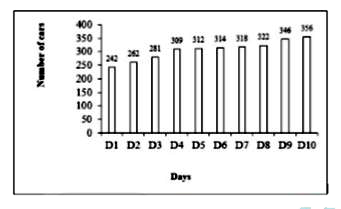
What is the difference in the number of cars parked on D3 and D8 ?View SolutionThe Bar graph given below presents the number of cars parked on ten different days in a parking area
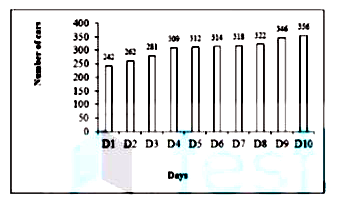
What is the total number of cars parked on all the ten days in the parking area ?View SolutionThe Bar graph given below presents the number of female employees working in two factories on six different days of a week.
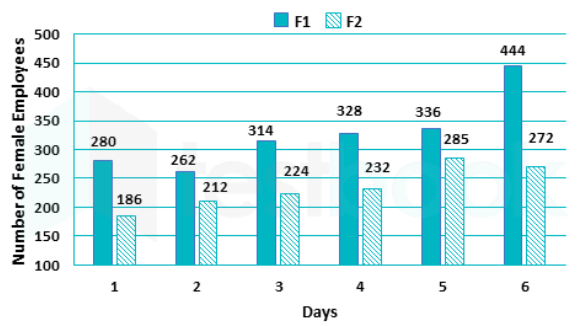
What is the difference (correct up to two decimal places) in the average number of females working per day in a factory F1 and the average number of females working per day in a factory F2?View SolutionThe Bar graph given below presents the amont (volume in litres) of water in ten different mixtures.
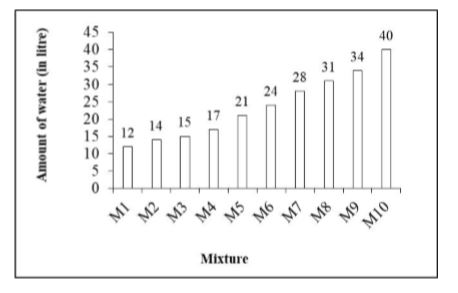
The amount of water in mixture M7 is how much more than the average amount of water per mixture ?View SolutionThe Bar graph given below presents the marks (out of 100) obtained by 10 students in a subject.
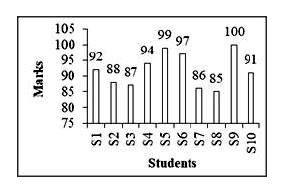
What is the average of the marks obtained by all the students?View Solution

