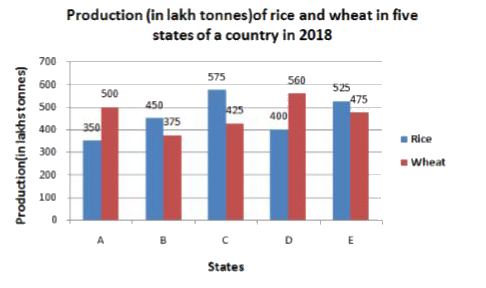
Study the graph and answer the question.
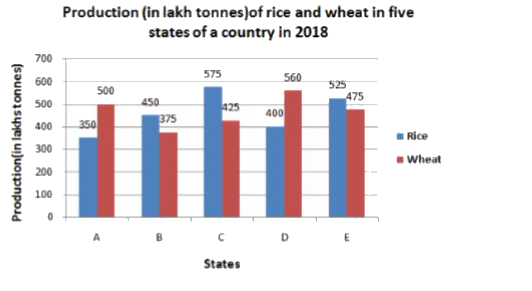
The number of states in which the production of rice is more than 20% of the total production of rice in all five states is ............
4
3
2
1
The correct Answer is:B
Step by step video, text & image solution for Study the graph and answer the question. The number of states in which the production of rice is more than 20% of the total production of rice in all five states is ............ by Maths experts to help you in doubts & scoring excellent marks in Class 14 exams.
Updated on:21/07/2023Similar Questions
Study the graph and answer the question
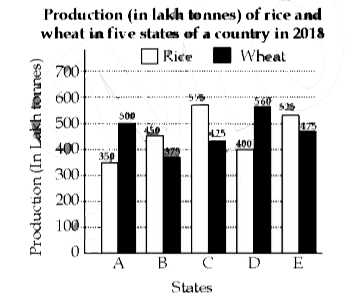
The number of states in which the production of wheat is more than 20% of the total production of rice in all five states is……..
View SolutionStudy the graph and answer the question
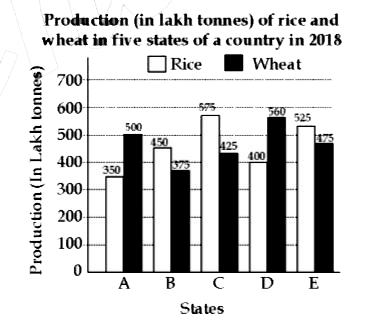
the ratio of the total production of rice in states C and E to the total production of wheat in states B and D is……..
View Solution
Knowledge Check
Study the following graph and answer questions
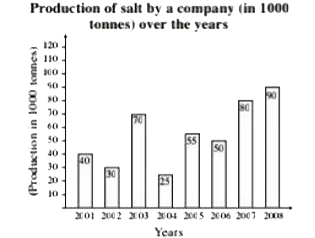
In how many of the given years was the production of salt more than the average production of the given years?A1B2C3D4Study the graph and answer the question.
Total production of wheat in states A, B and E is what percentage less than the total production of rice in states C, D and E?A10B12C12.2D11.1Study the graph and answer the following questions-
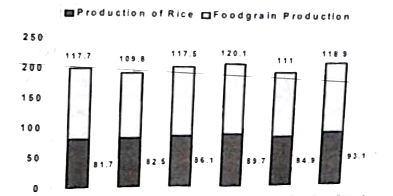
Over the given years what is average production of rice?A86.33 million tonnesB88.66 million tonnesC85 million tonnesD88 million tonnes
Study the following graph and answer the question based on the graph.
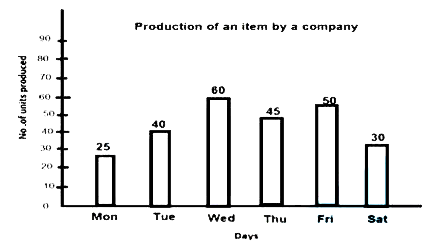
On which day the production was 1/5th of the total production?
View SolutionStudy the graph and answer the question
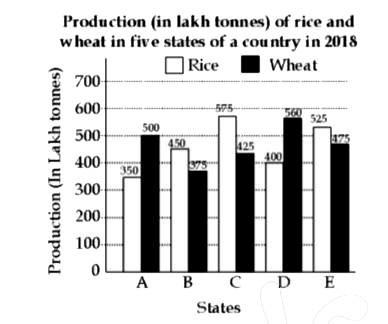
Total production of wheat in states A , B and E is what percentage less than the total production of rice in states C, D and E?
View SolutionThe given bar graph shows the number of tourists of various states. Study the graph and answer the question that follows.

The number of tourists to which of the following states is less than 10% of the total number of tourist ?
View SolutionStudy the pie chart and answer the question

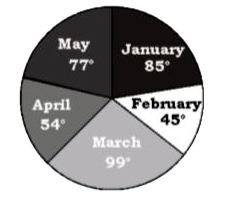
The number of months in which the number of computers sold was above 20% of the total number of computers sold in 5 months was:
View SolutionThe following graph shows the production of cotton bales of 100 kg each in lakhs by different states A, B, C, D and E over the years. Study the graph and answer the following Questions.
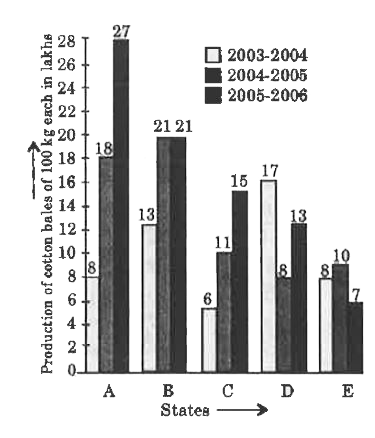
The number of States for which s the production of cotton in 2005 2006 is less than or equal to the preceding year is
View Solution
