The given bar graph shows the number of tourists of various states. Study the graph and answer the question that follows.
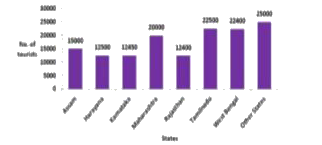
The number of tourists to which of the following states is less than 10% of the total number of tourist ?
Karnataka, Rajasthan, Haryana and Assam
Karnataka, Rajasthan and Haryana
Only Rajasthan
Karnataka and Rajasthan
The correct Answer is:B
Step by step video & image solution for The given bar graph shows the number of tourists of various states. Study the graph and answer the question that follows. The number of tourists to which of the following states is less than 10% of the total number of tourist ? by Maths experts to help you in doubts & scoring excellent marks in Class 14 exams.
Updated on:21/07/2023Topper's Solved these Questions
- SSC SELECTION POST (14 DEC 2020) SHIFT 1 MATRICULATION LEVEL BOOK - SSC SELECTION POSTCHAPTER - SSC SELECTION POST (14 DEC 2020) SHIFT 1 MATRICULATION LEVEL EXERCISE - Quantitative Aptitude
25 Videos
- SSC SELECTION POST (9 NOV 2020 SHIFT 1 HSC)BOOK - SSC SELECTION POSTCHAPTER - SSC SELECTION POST (9 NOV 2020 SHIFT 1 HSC)EXERCISE - MULTIPLE CHOICE QUESTIONS
25 Videos
Similar Questions
Study the given graph and answer the question that follows
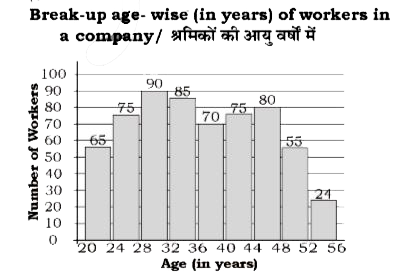
the number of workers whose age is 32 years or more but less than 44 years is:
View SolutionStudy the graph and answer the question
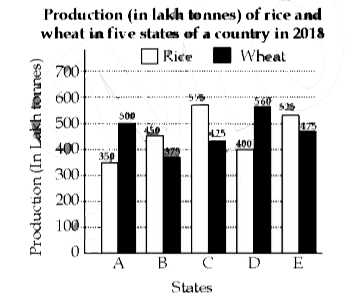
The number of states in which the production of wheat is more than 20% of the total production of rice in all five states is……..
View Solution
Knowledge Check
Study the following bar graph and answer the question that follows.
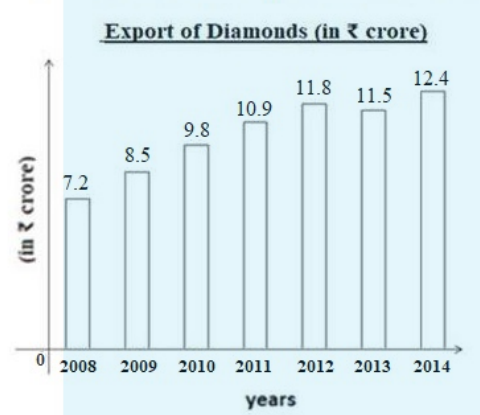
In which year was the maximin percentage increase in diamonds exports compared to the previous year?A2014B2009C2010D2012The given bar graph shows the biscuit exports of India over a period of five years. Study the graph and answer the questions that follows
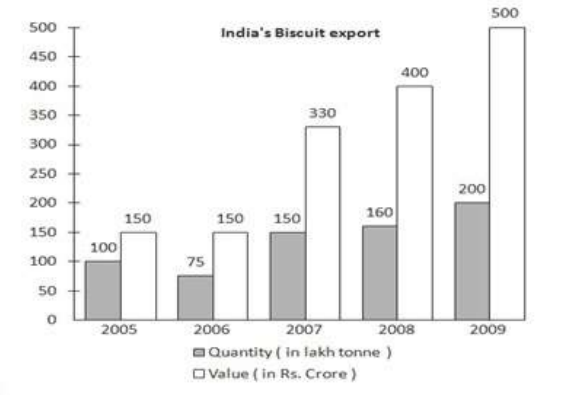
In which two year was the value per tonne equal?A2006 and 2007B2008 and 2009C2007 and 2008D2005 and 2006Study the given graph and answer the question that follows.
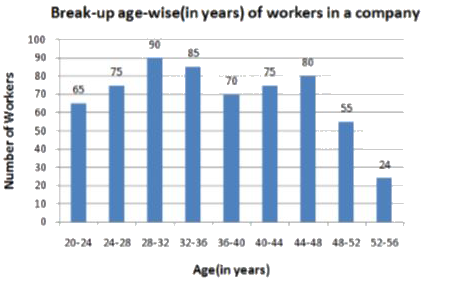
The number of workers whose age is 32 years or more but less than 44 years is:AA. 220BB. 215CC. 225DD. 230
Study the graph and answer the question that follows.
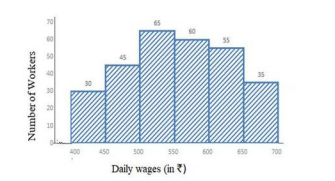 What is the ratio of the total number of workers whose daily wages are less than ₹ 500 to the total number of workers whose daily wages are ₹ 600 and above?
View SolutionStudy the graph and answer the question that follows
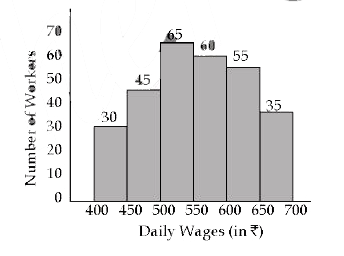
What is the ratio of the total number of workers whose daily wages are less than Rs 500 to the total number of workers whose daily wages are Rs 600 and above?
View SolutionStudy the given graph and answer the question that follows .
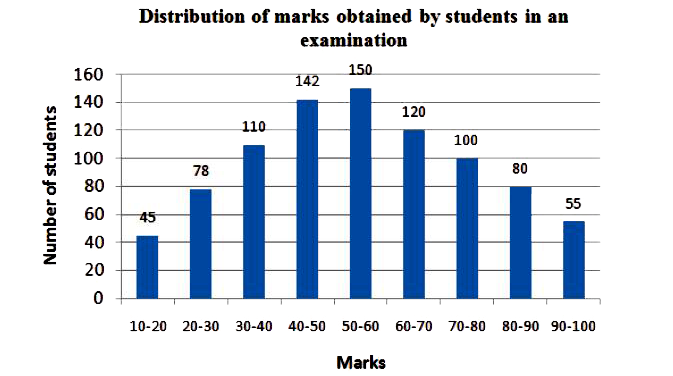
The number of students who obtained 20 marks or more but less than 60 marks is :
View SolutionThe given bar graph represents the number of teachers in different weight groups. Study the graph and answer the questions that follows
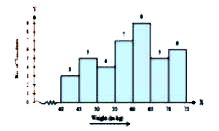
In which the following weight groups in the number of teachers the maximum
View SolutionStudy the graph and answer the question.
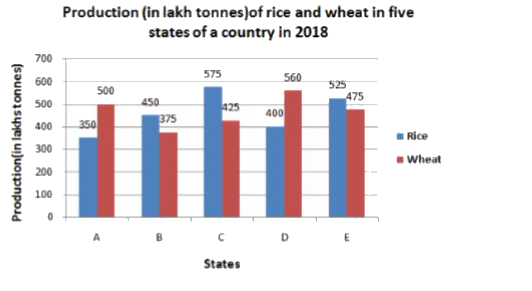
The number of states in which the production of rice is more than 20% of the total production of rice in all five states is ............
View Solution
