Study the given histogram that shows the marks obtained by students in a examination and answer the question that follows.
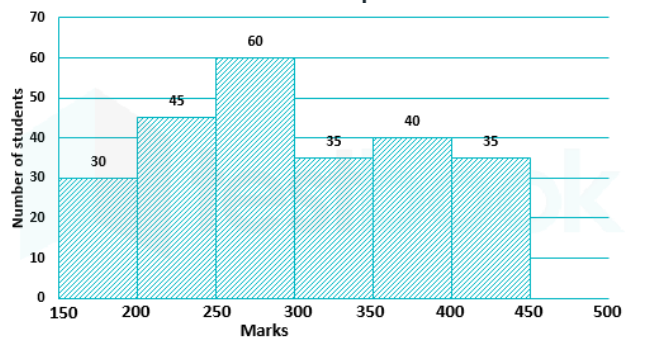
If the total marks obtained by students be represented as a pie chart, then the central angle of the sector representing marks 200 or more but less than 300, is :
(correct to the nearest degree)
154∘
128∘
68∘
88∘
The correct Answer is:A
Step by step video, text & image solution for Study the given histogram that shows the marks obtained by students in a examination and answer the question that follows. If the total marks obtained by students be represented as a pie chart, then the central angle of the sector representing marks 200 or more but less than 300, is : (correct to the nearest degree) by Maths experts to help you in doubts & scoring excellent marks in Class 14 exams.
Similar Questions
Knowledge Check
- Question 1 - Select One
Study the given histogram that shows the marks obtained by students in an examination and examination and answer the question that follows .
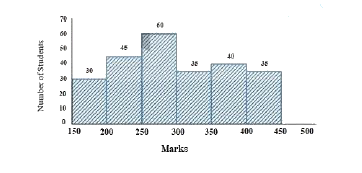
If the total marks obtained by students be represented as a pie chart ,then the central angle corresponding to marks 250 or more but less than 300 is :
(correct to the nearest degree)A88∘B68∘C128∘D188∘ - Question 2 - Select One
Study the given histogram that shows the marks obtained by students in an examination and answer the question that follows .
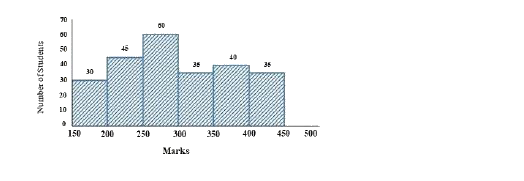
The number of students who obtained less than 250 marks is :A135B75C30D45 - Question 3 - Select One
Study the given histogram that shows the marks obtained by students in examination and answer the question that follows
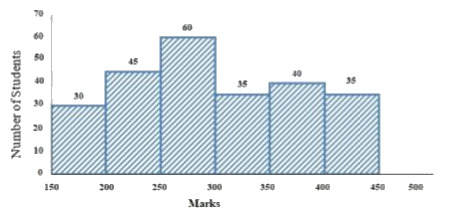
The number of students who obtained less than 200 marks is :AA)45BB)135CC)30DD)75
The marks obtained by a student in an examination are given below:

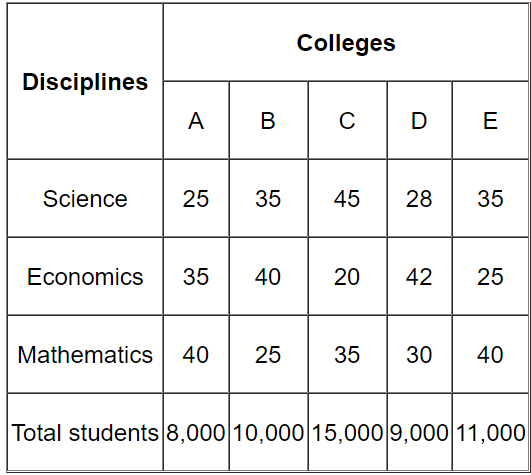
Represent the data using pie diagramView SolutionIF the data of the total students college wise, is represented by a pie chart, what is the central angle of the sector representing college E.
 View Solution
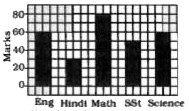
The above bar graph show the marks obtained by a students in an examination. What is the average marks obtained by the student ?View SolutionThe given pie chart shows the marks obtained in an examination by a student (in degree). Observe the pie chart and answer the question that follows.
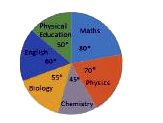
If the total marks are 720, then the marks obtained in Mathematics are:View SolutionThe histogram shows the marks obtained by 45 students of a class. Look at the histogram and answer the questions.
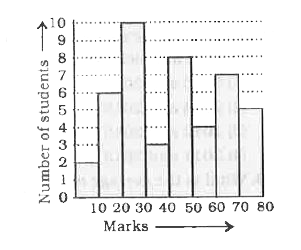
How many students have obtained marks less than 10 ?View Solution


