The marks obtained by a student in an examination are given below :

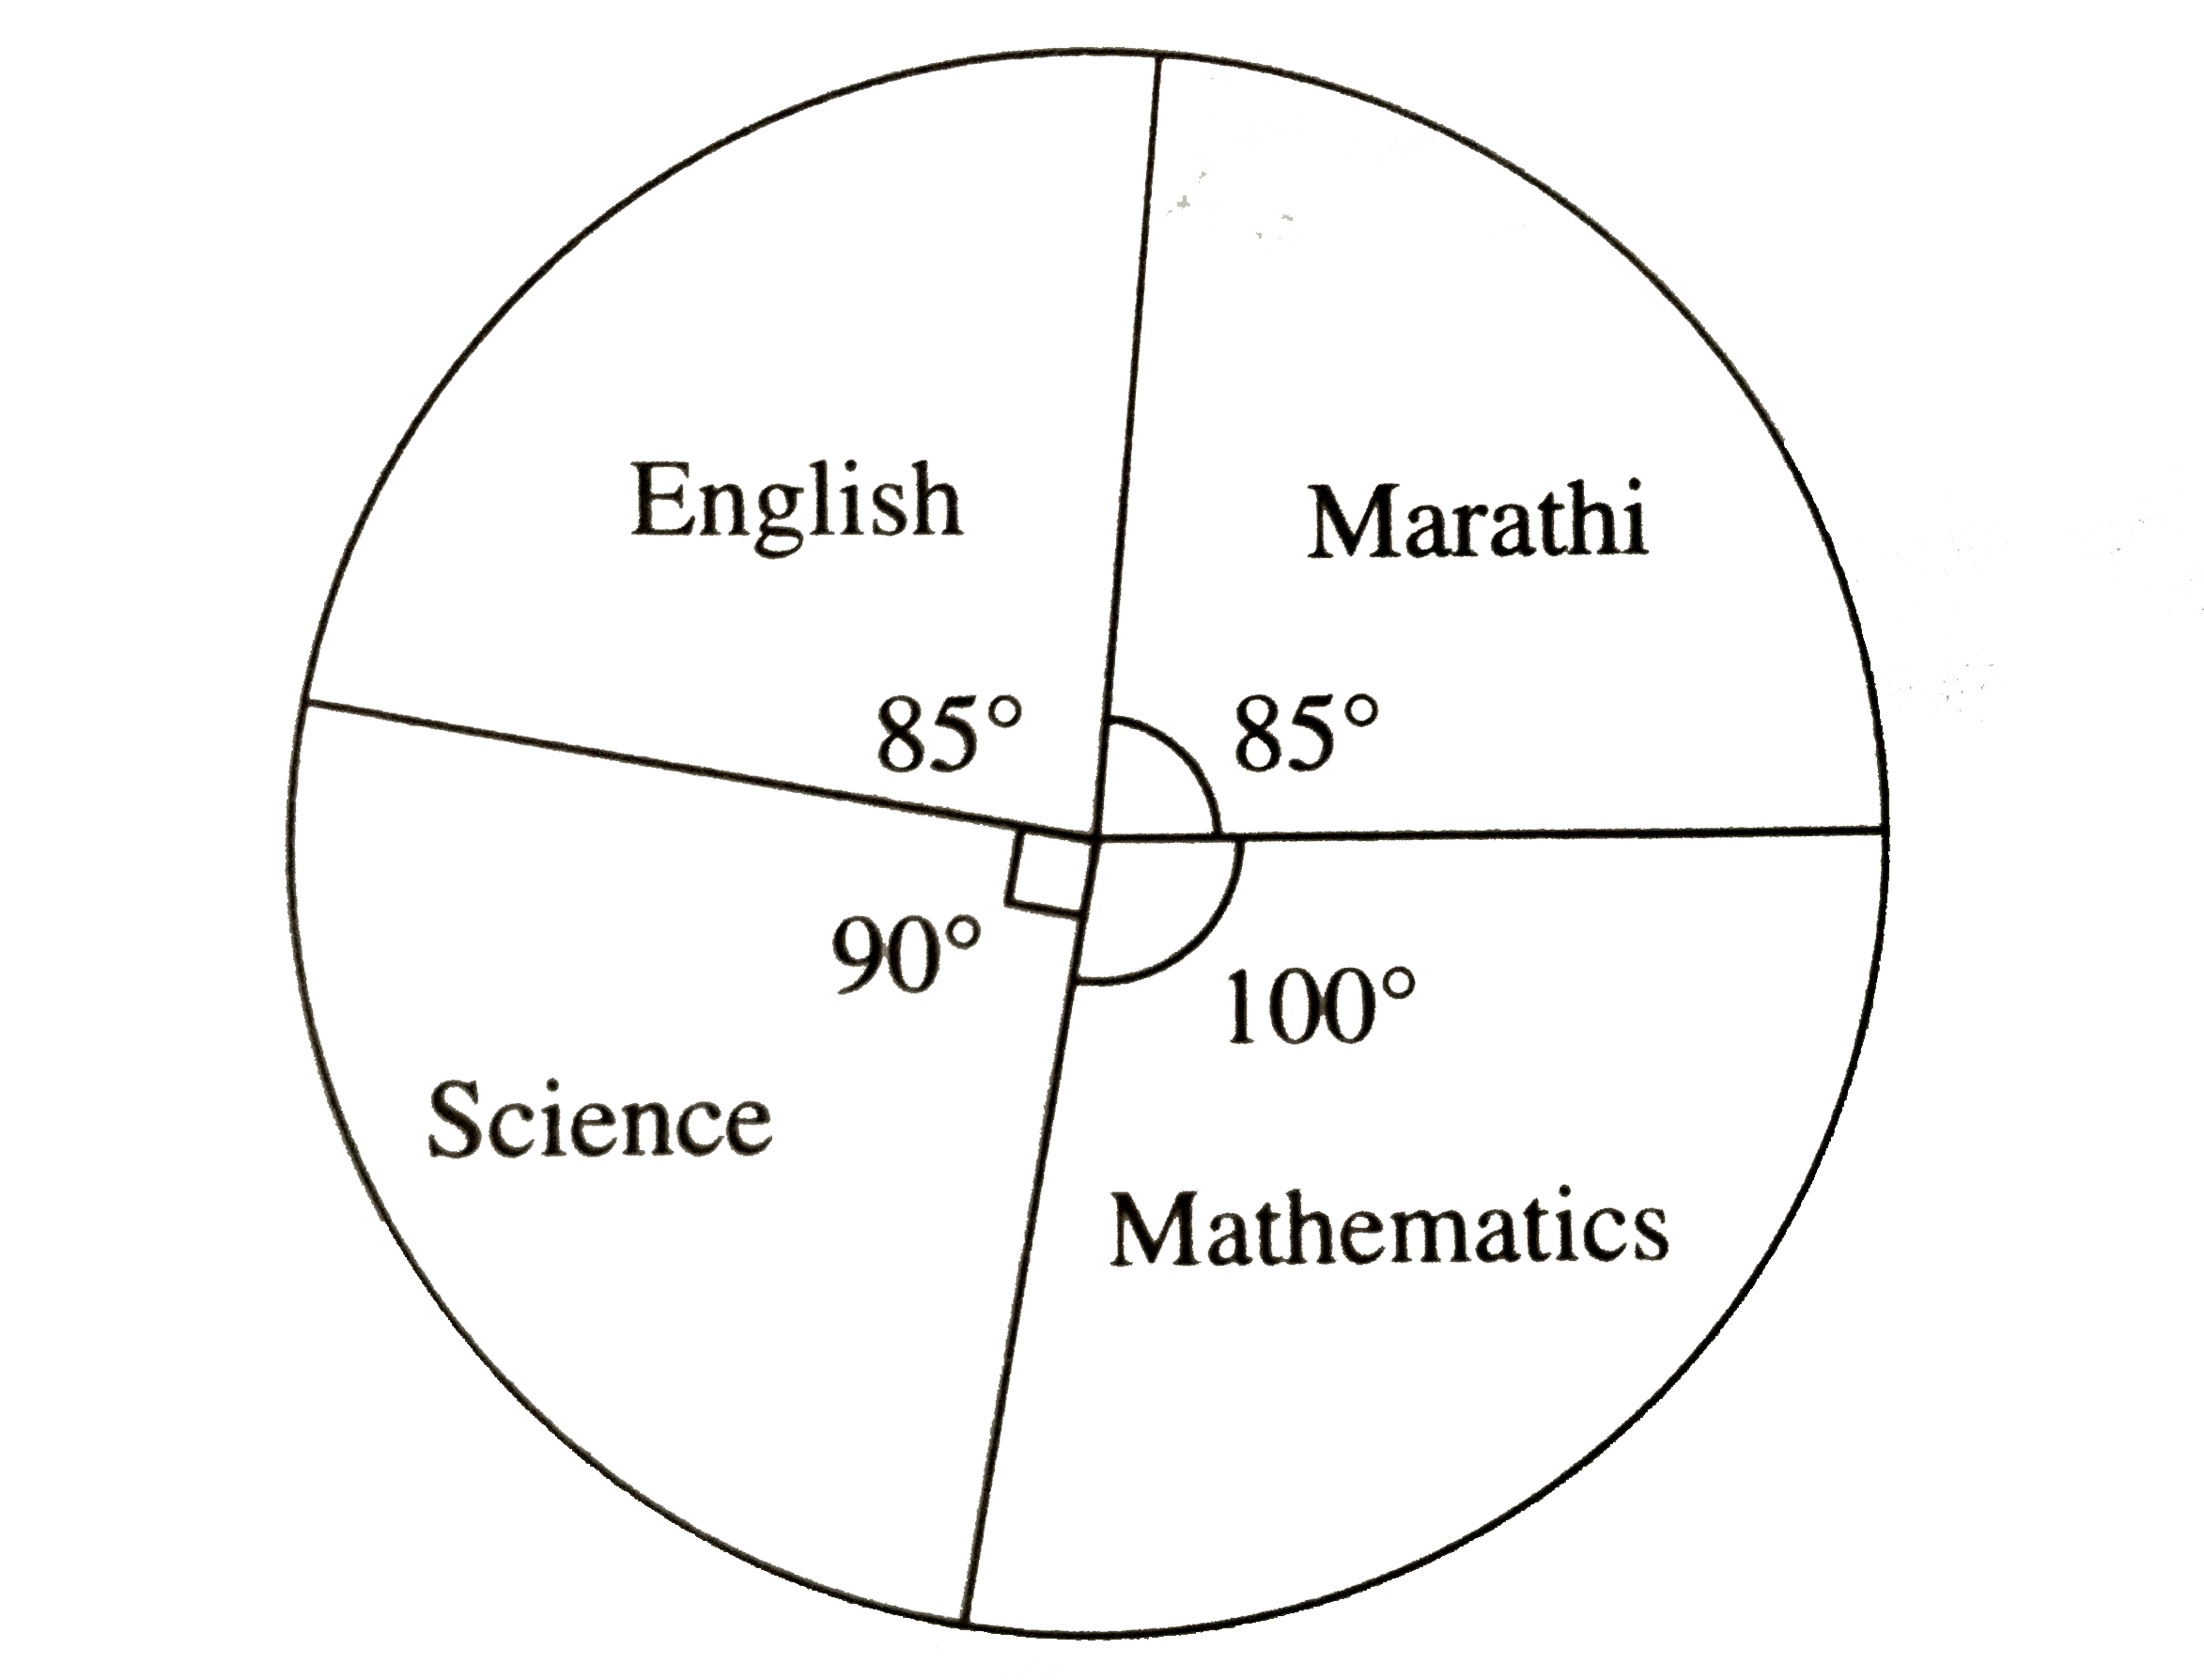
Represent the data using a pie diagram.
The marks are converted into component parts of 360∘ in the following table :
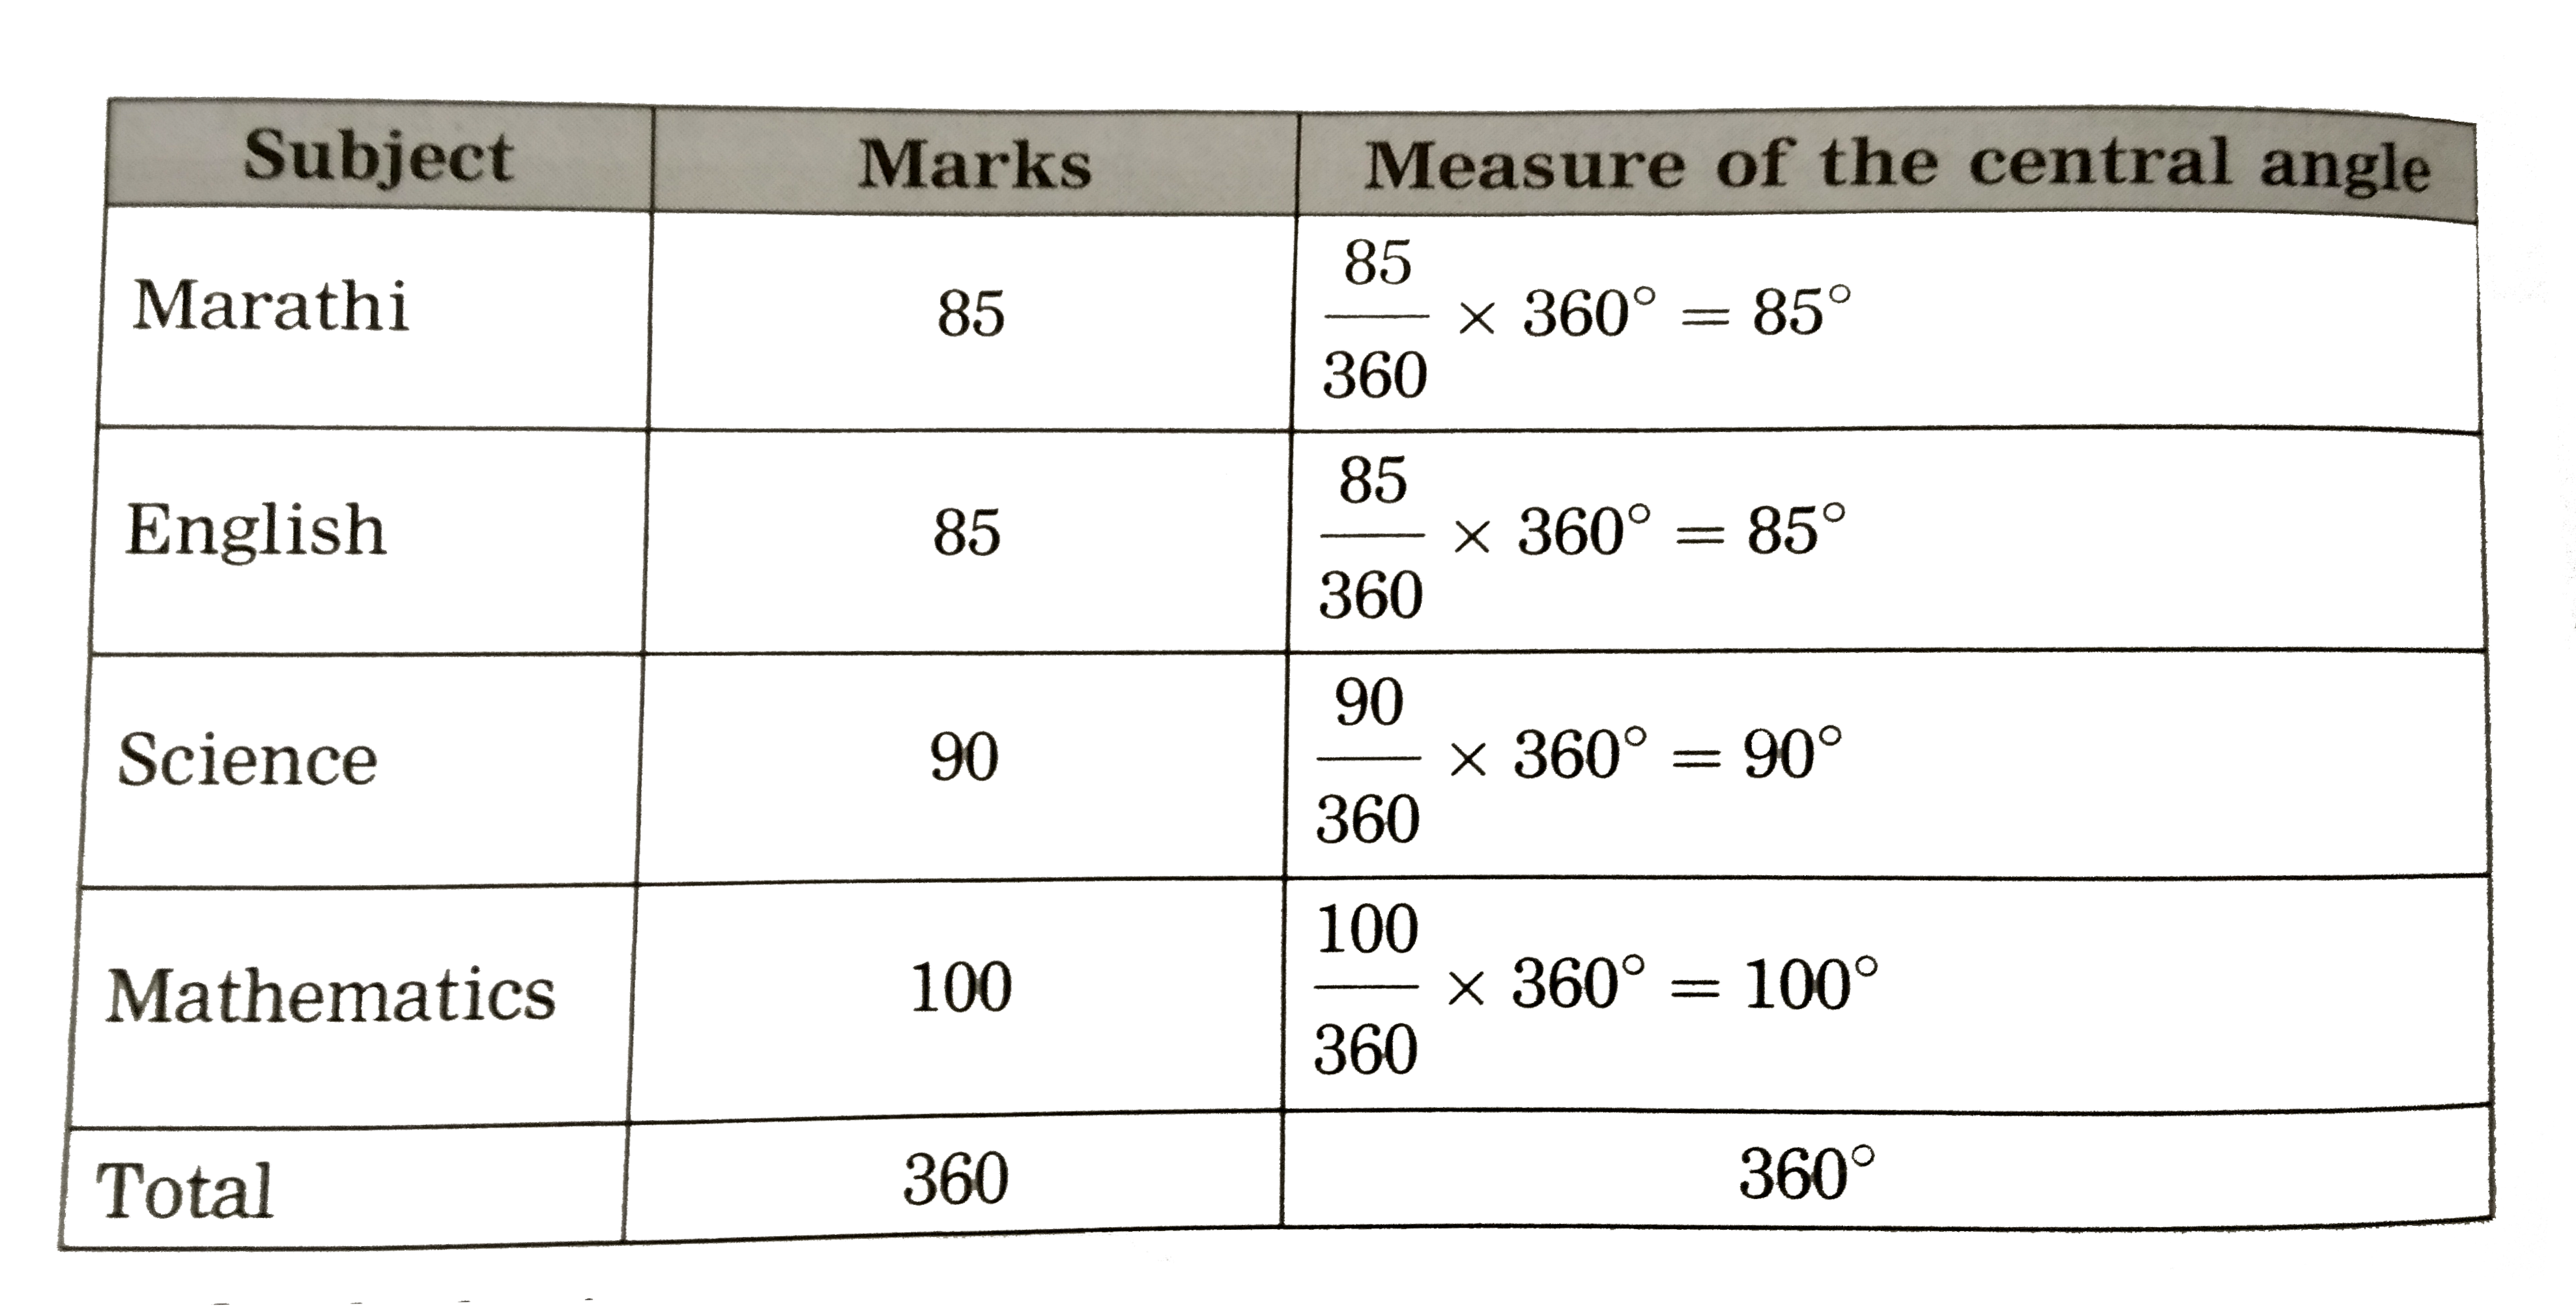
On the basis of the table, the pie diagram is drawn :
Topper's Solved these Questions
- BOOK - NAVNEET PUBLICATION - MAHARASHTRA BOARDCHAPTER - STATISTICSEXERCISE - Assignment 6.14videos
STATISTICS
- BOOK - NAVNEET PUBLICATION - MAHARASHTRA BOARDCHAPTER - STATISTICSEXERCISE - Assignment 6.25videos
STATISTICS
- BOOK - NAVNEET PUBLICATION - MAHARASHTRA BOARDCHAPTER - SIMILARITYEXERCISE - SUBJECTIVE TYPE20videos
SIMILARITY
- BOOK - NAVNEET PUBLICATION - MAHARASHTRA BOARDCHAPTER - THEOREMS EXERCISE - CIRCLE15videos
THEOREMS
Similar Questions
Knowledge Check
- Question 1 - Select One
The marks obtained by 60 students in a certain test are given below :
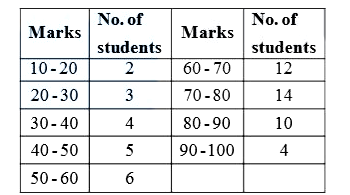
Median of the above data isA68.33B70C68.11DNone of these
The marks obtained by a student in various subjects in an examination are given below.

Represent the data using pie diagram.View SolutionThe marks obtained by 110 students in an examination are given below:
Find the mean marks of the studens.
 View Solution
The marks obtained by a student in an examination are given below: The total marks out of 100 obtained in various subjects are as follows:
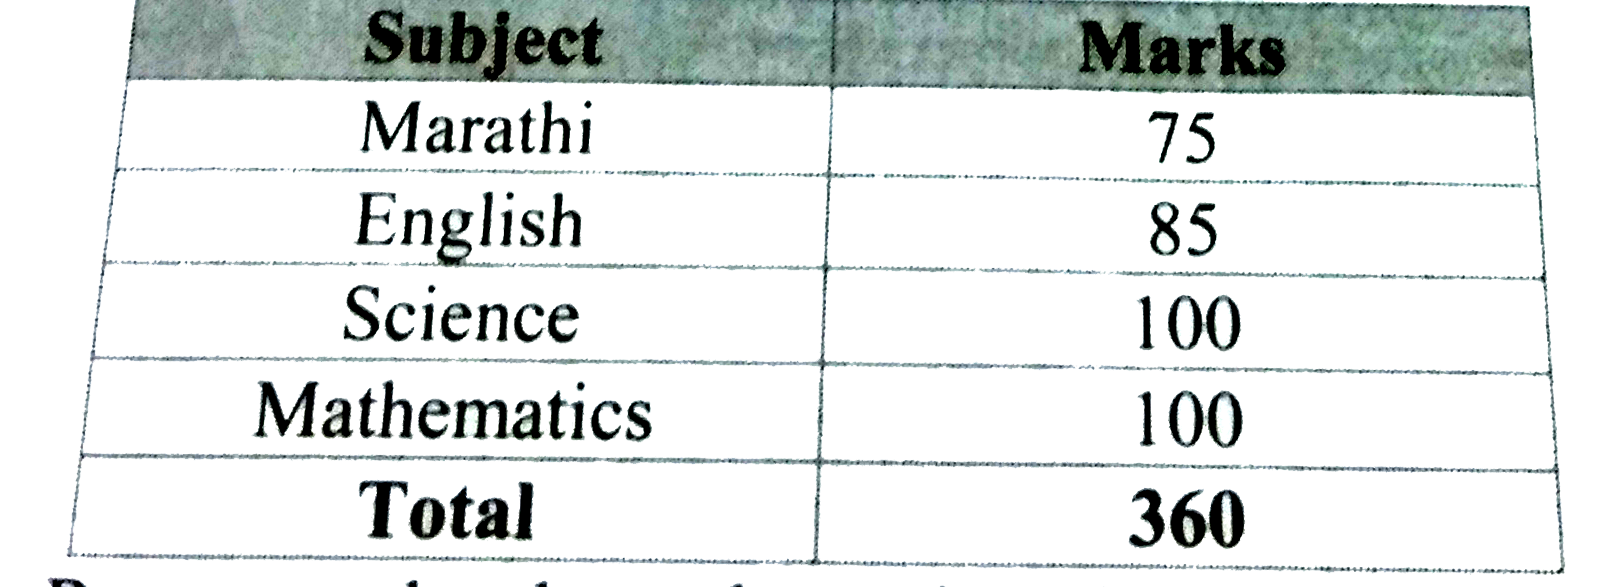
Represent the data using pie diagram.View SolutionThe marks obtained by 200 students in an examination are given below. : Draw a less than ogive for the above distribution and use less than ogive to find median.
View SolutionThe marks obtained by a student in examinations are given below :
80, 72, 84, 79, 90
find the average marks of the studentView SolutionThe following table gives the data on the marks obtained by two students 'A and B' in five subjects :

Represent the data by a multiple bar diagram.View SolutionThe marks obtained by 100 students of class is an examination are given below:
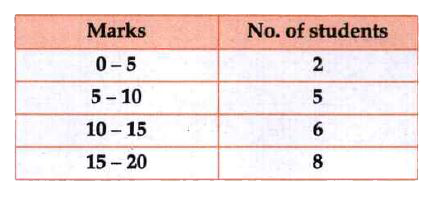
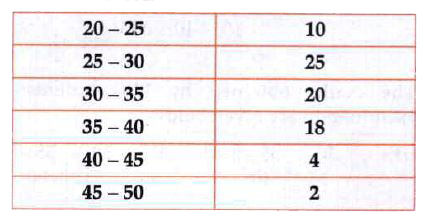
Draw 'a less than' type cumulative frequency curves (ogive). Hence, find median.View Solution


