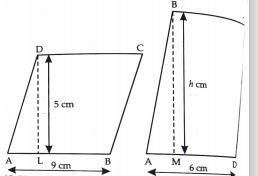
In a class, the teacher gave two simiar cardboard pieces which are in the shape of parallelogram to two groups. First group was asked find area of parallelogram,having AB as base. Another group was asked to find the height (h) of parallelogram having AD as base.
 What values are depicted?Solution in Punjabi
Step by step video & image solution for In a class, the teacher gave two simiar cardboard pieces which are in the shape of parallelogram to two groups. First group was asked find area of parallelogram,having AB as base. Another group was asked to find the height (h) of parallelogram having AD as base. What values are depicted? by Maths experts to help you in doubts & scoring excellent marks in Class 9 exams.
Updated on:21/07/2023Topper's Solved these Questions
Similar Questions
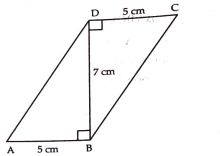
In the figure. Show that ABCD is a parallelogram.
 Calculate the area of ||gm ABCD.
View SolutionThe radius of a circle is 8 cm and the length of its chords is 12 cm. Fid the distance of the from the centre.
View SolutionHow many lines of symmetry does the above figure have ?
View SolutionDetermine the point of symmetry of a regular hexagon.
View SolutionIn the figure above (not to scale), ¯¯¯¯¯¯AB⊥¯¯¯¯¯¯CDandAD is the bisector of ∠BAE.AB=3cm and AC=5cm. Find CD.
View SolutionMatch the following Column A to Column B

View SolutionMatch the following Column A to Column B

View SolutionMatch the following Column A to Column B

View SolutionFind the area of figure given below.

View SolutionFind the area of the paths each having a uniform width in the following rectangular field.
ltimg src="https://d10lpgp6xz60nq.cloudfront.net/physics_images/PS_MATH_VII_C06_S01_002_Q01.png" width="80%"gt
View SolutionFind the perimeter of the figure given below.

View SolutionFind the area of the figure given below.

View SolutionThe inequation represented by the graph given below is :
View SolutionThe inequation that best describes the graph given below is _________
View SolutionThe inequation that best describes the following graph is _________
View SolutionIn Fig, find the value of x.
ltimg src="https://d10lpgp6xz60nq.cloudfront.net/physics_images/PS_MATH_IX_C12_S01_032_Q01.png" width="80%"gt
View Solution
