The daily maximum temperature recorded in a certain city during the month of November are as follows:
24.5, 25.8, 25.6, 20.7, 21.8,20.5,20.6,20.9,23.1,22.4,21.5,22.7,22.8,22.0,23.9,22.8,23.8,24.6,21.1,23.9
Represent them as a frequency distribution table with class size 1∘C.Solution in Punjabi
Step by step video & image solution for The daily maximum temperature recorded in a certain city during the month of November are as follows:24.5, 25.8, 25.6, 20.7, 21.8,20.5,20.6,20.9,23.1,22.4,21.5,22.7,22.8,22.0,23.9,22.8,23.8,24.6,21.1,23.9Represent them as a frequency distribution table with class size 1^@C. by Maths experts to help you in doubts & scoring excellent marks in Class 9 exams.
Updated on:21/07/2023Topper's Solved these Questions
Similar Questions
Define
Statistics as a subject.
View SolutionThree angles of a quadrilteral are respectively 50∘ and 110∘ and 100∘ . Find the fourth angles.
View SolutionFind the lateral surface and total surface area of a cuboid of length 80 cm, breadth 40 cm and height 20 cm.
View SolutionThe daily maximum temperatures (in degree Celsius) recorded in a certain city during the month of November are as follows: 25.8,24.5,25.6,20.7,218,20.5,20.6,20.9,22.3,22.7,23.1,22.8,22.9,21.7,21.3,20.5, 20.9,23.1,22.4,21.5,22.7,22.8,22.0,23.9,24.7,22.8,23.8,24.6,23.9,21.1 Represent them as a frequency distribution table with class size 10C
View Solutionकिसी शहर में नवम्बर माह के दौरान मापा गया प्रतिदिन का अधिकतम तापमान (डिग्री सेल्सियस में) नीचे दिया गया है:
25.8, 24.5, 25.6, 20.7, 21.8, 20.5, 20.6, 20.9, 22.3, 22.7, 23.1, 22.8, 22.9, 21.7, 21.3, 20.5, 20.9, 23.1, 22.4, 21.5, 22.7,22.8, 22.0, 23.9, 24.7, 22.8, 23.8, 24.6, 23.9, 21.1
वर्ग माप 1∘C लेकर इन्हें बारम्बारता बण्टन सारणी के रूप में प्रस्तुत कीजिये।
View SolutionThe correct order of size among Br^(+), Br, Br^(-)
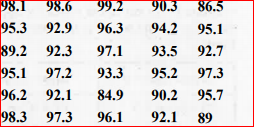
View SolutionThe relative humidity (in %) of a certain city for a month of 30 days was as follows :
98.198.699.290.386.595.392.996.394.295.189.292.397.193.592.795.197.293.395.297.396.292.184.990.295.798.397.396.192.189
(i) Construct a grouped frequency distribution table with classes 84-86 ,86-88, etc.
View SolutionThe relative humidity (in %) of a certain City for a September month of 30 days was as follows:

(i) Construct a grouped frequency distribution table with classes 84-86, 86,-88 etc.
(ii) What is the range of the data?
View SolutionThe relative humidity (in %) of a certain City for a September month of 30 days was as follows:

(i) Construct a grouped frequency distribution table with classes 84-86, 86,-88 etc.
(ii) What is the range of the data?
View SolutionThe relative humidity (in %) of a certain City for a September month of 30 days was as follows:

(i) Construct a grouped frequency distribution table with classes 84-86, 86,-88 etc.
(ii) What is the range of the data?
View SolutionThe relative humidity (in %) of a certain City for a September month of 30 days was as follows:

(i) Construct a grouped frequency distribution table with classes 84-86, 86,-88 etc.
(ii) What is the range of the data?
View SolutionThe daily maximum temperatures (in degree Celsius) recorded in a certain city during the month of November are as follows: 25.8,24.5,25.6,20.7,218,20.5,20.6,20.9,22.3,22.7,23.1,22.8,22.9,21.7,21.3,20.5, 20.9,23.1,22.4,21.5,22.7,22.8,22.0,23.9,24.7,22.8,23.8,24.6,23.9,21.1 Represent them as a frequency distribution table with class size 10C
View SolutionThe relative humidity (in %) of a certain city for a month of 30 days was as follows :
 : Construct a grouped frequency distribution table with classes 84 - 86, 86-88 etc.
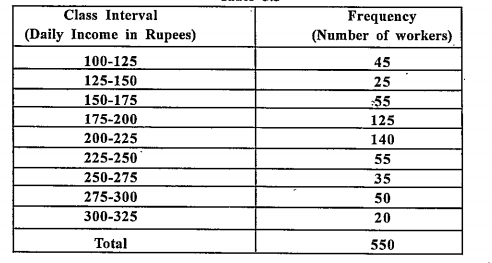
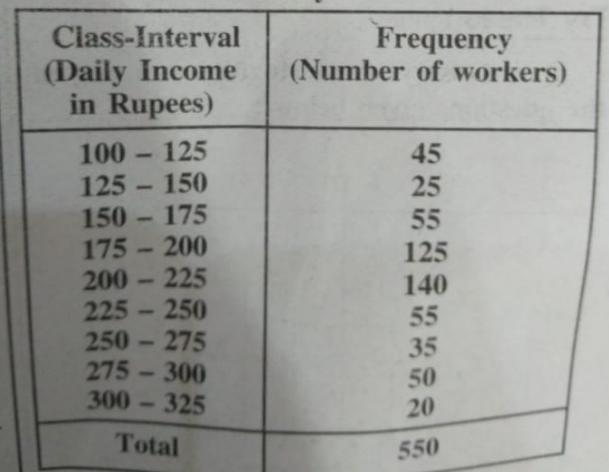
View SolutionStudy the following frequency distribution table and answer the question given below. Frequency Distribution of Daily Income of 550 workers of a factory

What is the size of the class intervals?
View SolutionThe maximum daily temperature of a city in a month is as follows in Celsius. Create a classified frequency distribution table (simple class) with appropriate classes. 29.2, 29.0, 28.1, 28.5, 32.9, 29.2, 34.2, 36.8, 32.0, 31.0,30.5,30.0, 33,32.5,35.5,34.0,32.9,31.5, 30.3,31.4,30.4,30.3,34.7,35.0,32.5, 33.5,29.0,29.9,33.5,30.2
View SolutionStudy the following disttribution table and answer the questions given below:
Frequency Distribution of Daily Income of 550 workers of a factory ? What is the size of the class intervals ?
View Solution