The following are the marks of 60 students in Mathematics
16,13,5,80,86,7,51,24,56,70,19,16,36,34,42,34,35,73,55,75,52,72,97,74,45,62,
68,86,35,81,75,55,26,95,31,7,78,
92,62,52,56,15,63,25,54,44,47,27,17,4,30
Construct a grouped distribution table with width 10 each of the class starting from 0-9.Solution in Punjabi
Step by step video & image solution for The following are the marks of 60 students in Mathematics16,13,5,80,86,7,51,24,56,70,19,16,36,34,42,34,35,73,55,75,52,72,97,74,45,62, 68,86,35,81,75,55,26,95,31,7,78, 92,62,52,56,15,63,25,54,44,47,27,17,4,30Construct a grouped distribution table with width 10 each of the class starting from 0-9. by Maths experts to help you in doubts & scoring excellent marks in Class 9 exams.
Updated on:21/07/2023Topper's Solved these Questions
Similar Questions
Define
Statistics as a subject.
View SolutionThree angles of a quadrilteral are respectively 50∘ and 110∘ and 100∘ . Find the fourth angles.
View SolutionFind the lateral surface and total surface area of a cuboid of length 80 cm, breadth 40 cm and height 20 cm.
View SolutionThe following are the marks (out of 100) of 60 students in Mathematics.
16,13,5,80,7,51,48,24,56,70,19,17,16,36,34, 42,34,42,34,34,35,72,55,75,31,52,28,97,74,45,62,68,86, 35,85,36,81,75,55,26,95,31,7,78,92,62,52,56,15,63,25,36,54,44,47,27,72,17,4,30.
Construct a grouped frequency table with width 10 of each class starting from 0-9.
View SolutionConstruct a grouped frequency distribution table with width 10 of each class, in such a way that one of the class is 10-20 (20 not included).
View Solutionकिसी कक्षा के छात्रों द्वारा प्राप्त अंकों की बारम्बारता सारणी निम्नलिखित है । संचयी बारम्बारता बंटन सारणी बनायें ।

View SolutionThe marks obtained by 40 students of a class in an examination are given below,
8,47,22,31,17,13,38,26,3,34,29,11,22,7,15,24,38,31,21,35,42,24,45,23,21,27,29,49,25,48,21,15,18,27,19,45,14,34,37,34.
Prepare a frequency distribution table with equal class intervals starting from 0-10 (where 10 is not included).
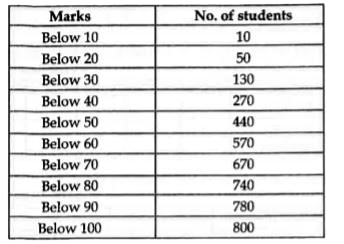
View SolutionThe following table shows the cumulative distribution of marks of 800 students in an examination. Construct a frequency distribution table.

View SolutionThe following table given the marks scored by 50 students in a 100 marks test of Mathematics.
Marks0−2020−4040−6060−80No of 31218107students
A student is selected randomly from the class.
Find the probability that the selected student.
View SolutionThe following table given the marks scored by 50 students in a 100 marks test of Mathematics.
Marks0−2020−4040−6060−80No of 31218107students
A student is selected randomly from the class.
Find the probability that selected student has scored 60 or more than 60 marks.
View SolutionThe marks scored by 40 students in a Mathematics test are given below:

Prepare the frequency distribution with classes 0-4, 5-9.....
View SolutionThe following table given the marks scored by 50 students in a 100 marks test of Mathematics.
Marks0−2020−4040−6060−80No of 31218107students
A student is selected randomly from the class.
Find the probability that selected student has scored 60 or more than 60 marks.
View SolutionThe following table given the marks scored by 50 students in a 100 marks test of Mathematics.
Marks0−2020−4040−6060−80No of 31218107students
A student is selected randomly from the class.
Find the probability that selected student has scored 60 or more than 60 marks.
View Solution60 विद्यार्थियों के गणित में (100 में से) प्राप्त किए गए अंक निम्नलिखित हैं :
16,13,5,80,86,7,51,48,24,56,70, 19,61,17,16,36,34,42,34,35,72,55,75,
31,52,28,72,97,74,45,62,68,86,35, 85,36,81,75,55, 26,95,31,7,78,92,62,
52, 56,15,63,25,36,54,44,47,27,72,17,4, 30.
वर्ग (0 - 9 से प्रारंभ करते हुए और प्रत्येक वर्ग की चौड़ाई 10 रखते हुए, एक वर्गीकृत बारंबारता बंटन सारणी बनाइए।
View Solutionनीचे किसी कक्षा के 50 विद्यार्थियों द्वारा प्राप्त अंकों का एक संचयी बारंबारता बंटन दर्शाया गया है:

उपरोक्त के लिए एक बारंबारता बंटन सारणी बनाइए।
View Solution
