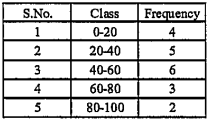
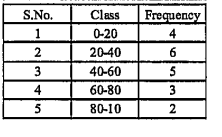
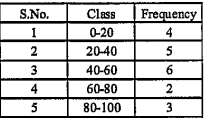
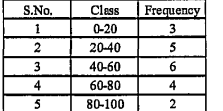
20 students of a class obtained following respective marks out of 100 marks in subject Mathematics:54,46,24,36,84,70,16,58,6,82,44,54.32,64.8,66,52,28,16 and 30 Grouped frequency distribution table of above will be


The correct Answer is:A
Similar Questions
The marks obtained (out of 20) by 30 students of a class in a test are as follows:
14, 16, 15, 11, 15, 14, 13, 16, 8, 10, 7, 11, 18, 15, 14, 19, 20, 7, 10, 13, 12, 14, 15, 13, 16, 17, 14, 11, 10, 20.
Prepare a frequency distribution table for the above data using class intervals of equal width in which one class interval is 4-8 (excluding 8 and including 4).
View SolutionThe marks scored by 40 students of class VIII in mathematics are given below: 81,55,68,79,85,43,29,68,54,73,47,35,72,64,95,44,50,77,64, 35,79,52,45,54,70,83,62,64,72,92,84,76,63,43,54,38,73,68,52,54. Prepare a frequency distribution with class size of 10 marks.
View Solution
Knowledge Check
Following table represents the marks in a subject of students of a class.
Marks102030334045Number of students2481023
Mode of above distribution isA48B33C30D10
The marks scored by 40 students of class VIII in mathematics are given below: 81,55,68,79,85,43,29,68,54,73,47,35,72,64,95,44,50,77,64, 35,79,52,45,54,70,83,62,64,72,92,84,76,63,43,54,38,73,68,52,54. Prepare a frequency distribution with class size of 10 marks.
View SolutionTime taken is seconds by 25 students in an examination to solve certain question is given below.
20,16,20,27,28,30,33,57,50,40,42,46,28,43,46,46,48,49,52,58,59,60,64,52.
By taking class interval of size 10, make a frequency distribution table.
View SolutionIn a mathematics test given to 15 students, the following marks (out of 100) are recorded:41, 39, 48, 52, 46, 62, 54, 40, 96, 52, 98, 40, 42, 52, 60 Find the mean, median and mode of this data
View SolutionWe are given the following marks secured by 25 students in an examination .
23,28,30,32,35,36,36,40,41,43,44,44,45,48,49,52,53,54,56,56,58,61,62,65,68.
(i)Arrange this data in the form of a frequency distribution taking the following class intervals.
20-29,30-39,40-49,50-59, and 60-69
(ii) Draw the frequency polygon and ogive for the above data.
View SolutionThe marks obtained by 17 students in a mathematics test (out of 100) are given below:
90,79,76,82,65,96,100,91,82,100,49,46,64,48,72,66,68.
Find he range of the above data.
View SolutionIn a mathematics test given to 15 students, the following marks (out of 100) are recorded:41, 39, 48, 52, 46, 62, 54, 40, 96, 52, 98, 40, 42, 52, 60 Find the mean, median and mode of this data
View SolutionThe marks (out of 100) obtained by a group of students in Mathematics test are :
88, 74, 90, 88, 40, 46, 58, 96, 82, and 78. Find :
mean marks obtained by the group
View Solution
