The total number of live births in a specific locality during different months of a specific year was obtained from the office of the Birth Registrar. This set of data may be called
Primary data
Secondary data
Recorded data
Countable data
To solve the question regarding the classification of the data on live births in a specific locality, we can follow these steps:
1. Understand the Context: The question provides information about the total number of live births recorded in a specific locality over different months of a specific year. This data is obtained from the office of the Birth Registrar.
Hint: Think about where the data is sourced from and how it is collected.
2. Identify the Type of Data: The options given are:
- Primary data
- Secondary data
- Recorded data
- Countable data
Hint: Recall the definitions of each type of data. Primary data is collected firsthand, while secondary data is collected from existing sources.
3. Determine the Source of Data: Since the data is directly obtained from the Birth Registrar's office, it indicates that this data was collected specifically for the purpose of recording live births in that locality.
Hint: Consider whether the data was collected for the first time or if it was compiled from other sources.
4. Classify the Data: Based on the understanding that the data is directly collected from a primary source (the Birth Registrar), we can conclude that this data is classified as primary data.
Hint: Remember that primary data is original and collected for a specific purpose, unlike secondary data which is derived from existing information.
5. Final Answer: Therefore, the set of data regarding the total number of live births in the locality is called primary data.
Conclusion
The correct answer to the question is that the data may be called primary data.
- Primary data
- Secondary data
- Recorded data
- Countable data
The correct answer to the question is that the data may be called primary data.
Similar Questions
The bar-chart is showing the number of accidents in a city during the first six month of a year. Examine the bar chart and answer the following questions.
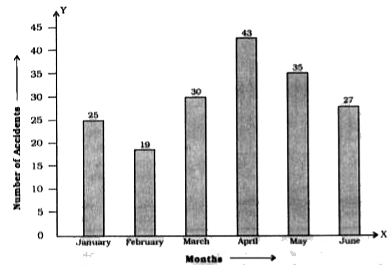
Percentage of decrease in t he number of accidents from May to June is :
View SolutionRead the following passage and answer the questions:
Our body has the defence system to protect against invading microbes. The outermost line of defence is the barrier that prevents the entry of microbes into the body, and if they enter, phagocytic cells kill the microbes. This forms the local defence system of the body. The innermost line of defence includes formation of specific antibodies that combine with the antigen (microbe) and then destroy it. This is called specific immunity.
How is the local defence system different from the antibody-producing specific immune system?
View Solution
Knowledge Check
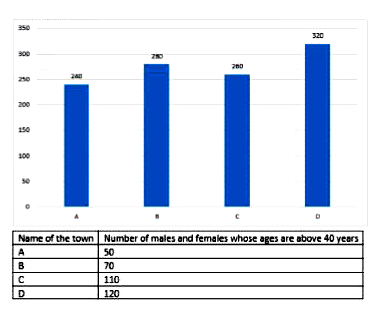
The bar graph shows the total number of male and female lives in four different towns and table shows the number of males and females whose ages are above 40 years. Read the data carefully and answer the questions below:
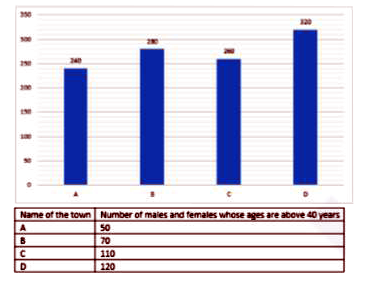
If 40% of population in town B whose ages are below and equals to 40 years are male and 40% of population in town D whose ages are below and equals to 40 years are female. Find the difference between the females of town B and D whose ages are below and equals to 40 years.A46B52C49D58The bar graph shows the total number of male and female lives in four different towns and table shows the number of males and females whose ages are above 40 years. Read the data carefully and answer the questions below:
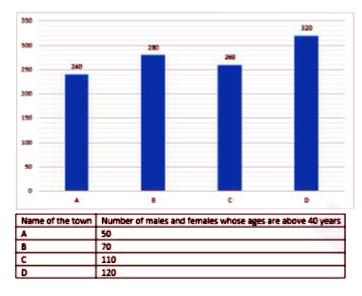
Number of males and females in town A whose ages are below and equals to 40 years is what percent less than those number of males and females in town D whose ages are below and equals to 40 years.A10%B12%C7%D5%The bar graph shows the total number of male and female lives in four different towns and table shows the number of males and females whose ages are above 40 years. Read the data carefully and answer the questions below:
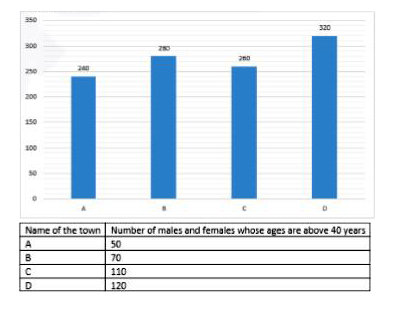
If in another town E, total males and females are 10% more than the total males and females in town A and those males and females whose ages are above 40 years is 20% more than those males and females whose ages are above 40 years in town C. find the number of those males and females in town E whose ages are below and equals to 40 years.A134B128C142D124
The bar graph shows the total number of male and female lives in four different towns and table shows the number of males and females whose ages are above 40 years. Read the data carefully and answer the questions below:
Ratio of age A after two years to the present age of B is 5: 6 and ratio of age of A 8 years hence to the age of B 6 year hence is 6: 7. Find B’s present age.
View SolutionThe bar graph shows the total number of male and female lives in four different towns and table shows the number of males and females whose ages are above 40 years. Read the data carefully and answer the questions below:
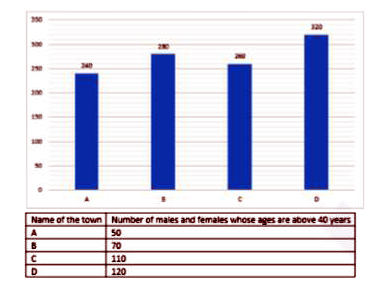
Find the ratio of the those number of males and females whose ages are above 40 years in town A and B to those males and females whose ages are below and equals to 40 years in town D.
View SolutionThe bar graph shows the total number of male and female lives in four different towns and table shows the number of males and females whose ages are above 40 years. Read the data carefully and answer the questions below:
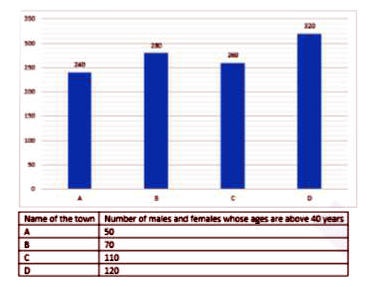
Find the average number of those males and females whose ages are below and equals to 40 years of town A, C and D.
View SolutionThe Bar graph given below presents the number of books sold by a bookseller during different months of a year.
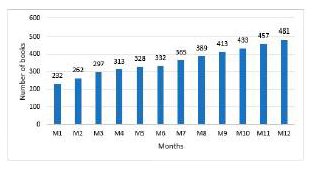
What is the total number of books sold by the bookseller in the year?
View SolutionThe data shows the information on the number of children vaccinated in the year 2016 in different cities:
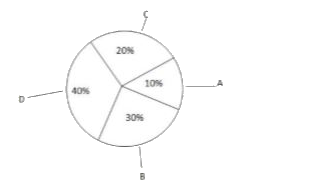
If the total number of children vaccinated in the year 2016 is 1,20,000, then how many children from city "'A' were vaccinated?
View Solution
