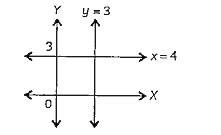
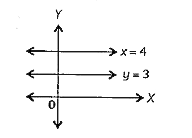
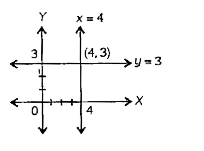
Show the graphical representation of given pair of linear equations x = 4 and y = 3.


None of these
The correct Answer is:C
To graphically represent the given pair of linear equations x=4 and y=3, we will follow these steps:
Step 1: Understand the equations
The equations given are:
1. x=4
2. y=3
Step 2: Graph the equation x=4
The equation x=4 represents a vertical line where the x-coordinate is always 4, regardless of the value of y.
- To plot this line, we can choose several values for y:
- If y=0, then the point is (4,0)
- If y=1, then the point is (4,1)
- If y=2, then the point is (4,2)
- If y=−1, then the point is (4,−1)
Plot these points on the graph and draw a vertical line through them at x=4.
Step 3: Graph the equation y=3
The equation y=3 represents a horizontal line where the y-coordinate is always 3, regardless of the value of x.
- To plot this line, we can choose several values for x:
- If x=0, then the point is (0,3)
- If x=1, then the point is (1,3)
- If x=2, then the point is (2,3)
- If x=−1, then the point is (−1,3)
Plot these points on the graph and draw a horizontal line through them at y=3.
Step 4: Identify the intersection point
The intersection point of the two lines x=4 and y=3 is where they meet. This point can be found by substituting the values:
- From x=4, we have x coordinate as 4.
- From y=3, we have y coordinate as 3.
Thus, the intersection point is (4,3).
Step 5: Final graphical representation
Now, we can represent both lines on the same graph:
- Draw a vertical line at x=4.
- Draw a horizontal line at y=3.
- Mark the intersection point (4,3).
The equations given are:
1. x=4
2. y=3
The equation x=4 represents a vertical line where the x-coordinate is always 4, regardless of the value of y.
- If y=0, then the point is (4,0)
- If y=1, then the point is (4,1)
- If y=2, then the point is (4,2)
- If y=−1, then the point is (4,−1)
The equation y=3 represents a horizontal line where the y-coordinate is always 3, regardless of the value of x.
- If x=0, then the point is (0,3)
- If x=1, then the point is (1,3)
- If x=2, then the point is (2,3)
- If x=−1, then the point is (−1,3)
The intersection point of the two lines x=4 and y=3 is where they meet. This point can be found by substituting the values:
- From x=4, we have x coordinate as 4.
- From y=3, we have y coordinate as 3.
Now, we can represent both lines on the same graph:
- Draw a vertical line at x=4.
- Draw a horizontal line at y=3.
- Mark the intersection point (4,3).
Topper's Solved these Questions
- SAMPLE PAPER 5BOOK - EDUCART PUBLICATIONCHAPTER - SAMPLE PAPER 5EXERCISE - SECTION - B
20 Videos
- SAMPLE PAPER 5BOOK - EDUCART PUBLICATIONCHAPTER - SAMPLE PAPER 5EXERCISE - SECTION - C
10 Videos
- SAMPLE PAPER 4BOOK - EDUCART PUBLICATIONCHAPTER - SAMPLE PAPER 4EXERCISE - PART-B(SECTION-V)
5 Videos
- SAMPLE PAPER 6BOOK - EDUCART PUBLICATIONCHAPTER - SAMPLE PAPER 6EXERCISE - SECTION- C
10 Videos
Similar Questions
Knowledge Check
The number of solutions of the pair of linear equations x + 3y = 4 and 2x + y = 5 is:
AOneBinfiniteCNo SolutionDTwoThe solution of pair of linear equations 3x+4y=10andx−y=1, will be :
Ax=2,y=3Bx=−2,y=1Cx=2,y=1DNone of these
Solution of pair of linear equations x+2y=2andx−3y=7 is
View SolutionSolve the pair of linear equations 3x−y=3and7x+2y=20.
View SolutionSolve the pair of linear equations 2x+3y=11and2x−4y=−24.
View SolutionSolve the pair of linear equations. y−4x=1 and 6x−5y=9
View SolutionWhat is the value of k, for which the graphical representation of the simultaneous equations 5x−3y=1 and 2x−ky=−4 are parallel lines ?
View SolutionThe solutions of pair of linear equations x+y=3 and 4x-3y=26,will be:
View Solution
