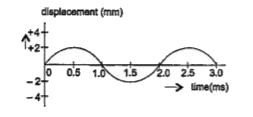
The figure shows displacement time graph of a wave. The frequency of this wave is displacement (mm)

4 Hz
500 Hz
1000 Hz
The correct Answer is:C
Time taken in one cycle=
f = Number of cycles in one second
Similar Questions
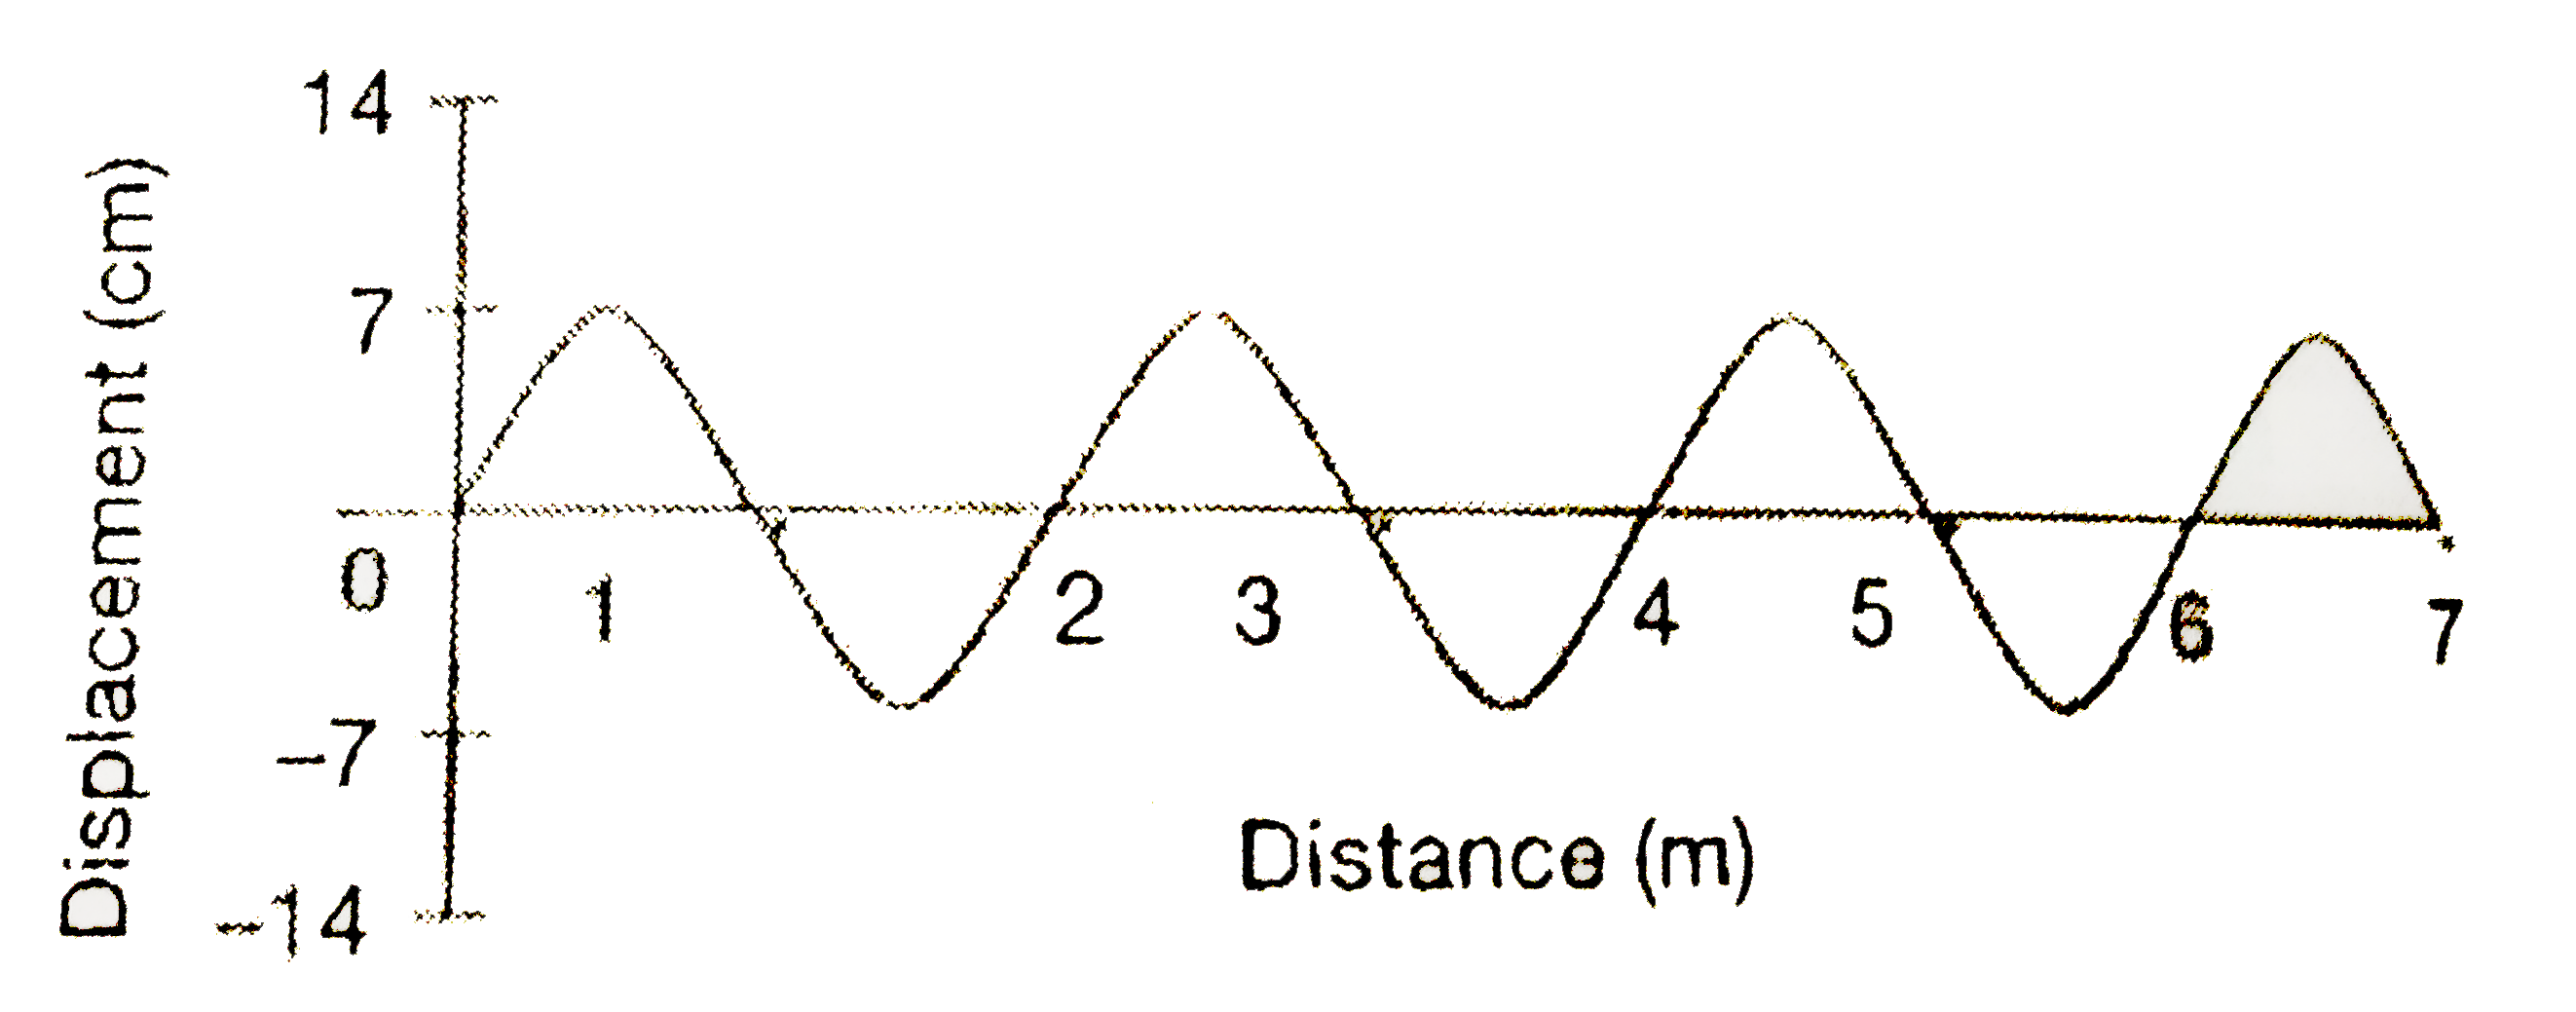
The adjacent figure shows a displacement vs distance graph of a wave. If the velocity of the wave is 14ms−1, calculate its
(a) wavelength , (b) frequency and (c) amplitude of the wave

View SolutionThe adjacent figure shows a displacement vs distance graph of a wave. If the velocity of the wave is 14ms−1, calculate its
(a) wavelength , (b) frequency and (c) amplitude of the wave

View Solution
Knowledge Check
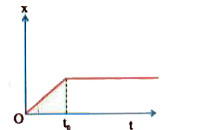
Figure show the displacement - time graph of a particle moving on the x-axis
 Athe particle is continuously going in positive X directionBthe particle is at restCthe velocity increases up to a time t0 and then becomes constant.Dthe particle moves at constant velocity up to a time t0 and then stops.
In a stationary wave, displacement
ANodes are pressure nodesBNodes are pressure antinodesCNodes are position of atmospheric pressureDAntinode are points of constant pressure
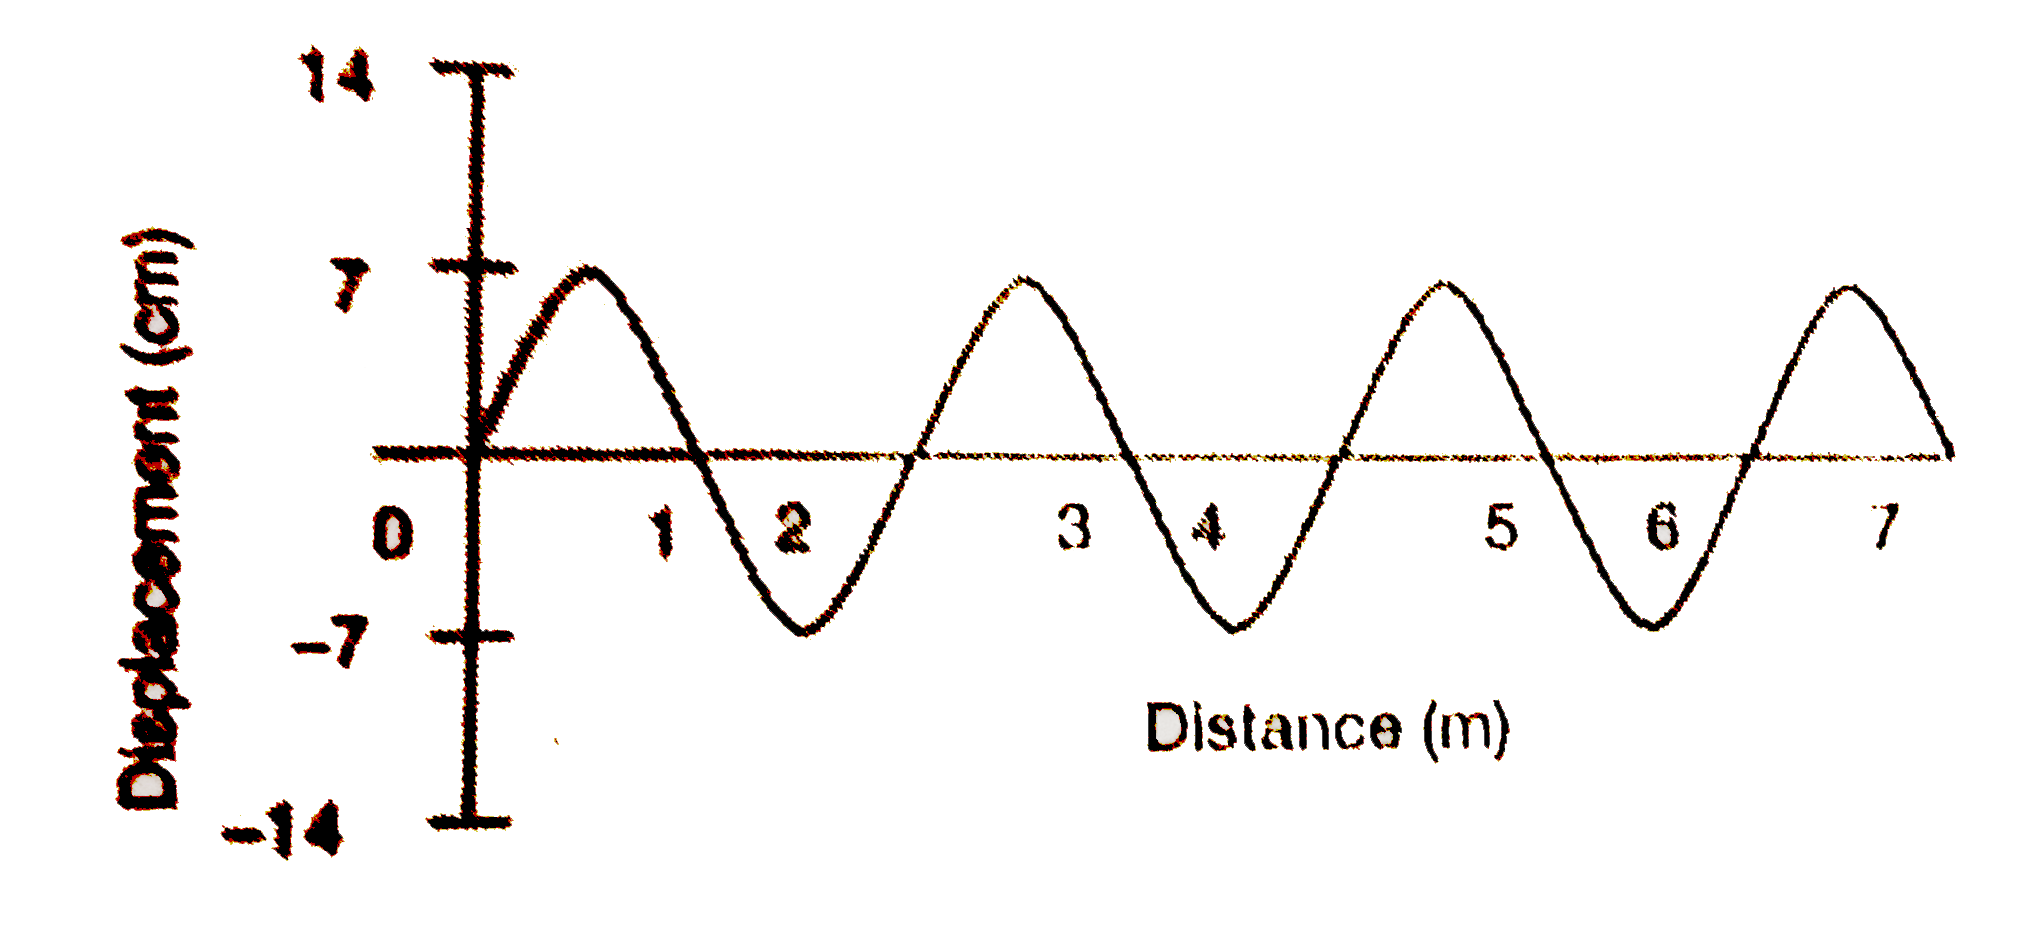
The adjacent figure shows a displacement vs distance graph of a wave. If the velocity of the wave is 14ms−1 calculate its

(i) wavelength,
(ii) frequency and
(iii) amplitude of the wave
View SolutionThe adjacent figure shows a displacement vs distance graph of a wave. If the velocity of the wave is 14ms−1, calculate its
(a) wavelength , (b) frequency and (c) amplitude of the wave

View SolutionThe adjacent figure shows a displacement vs distance graph of a wave. If the velocity of the wave is 14ms−1, calculate its
(a) wavelength , (b) frequency and (c) amplitude of the wave

View SolutionFigure shows the displacement time graph of a particle moving on the X-axis

View SolutionFigure shows the displacement time graph of a particle moving on the X-axis

View SolutionFigure shows the displacement-time graph of a particle moving on the X-axis

View Solution
