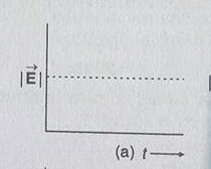
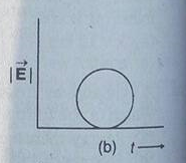
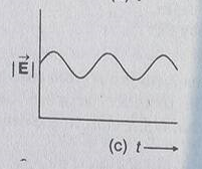
Which of the following diagrams represent the variation of electric field vector with time for a circularly polarised light ?
A
B
C
D
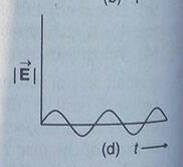
Text Solution
The correct Answer is:A
|
Similar Questions
Knowledge Check
Which of the following diagrams represent the veriation of electric field vector with time for a circularly polarised light
A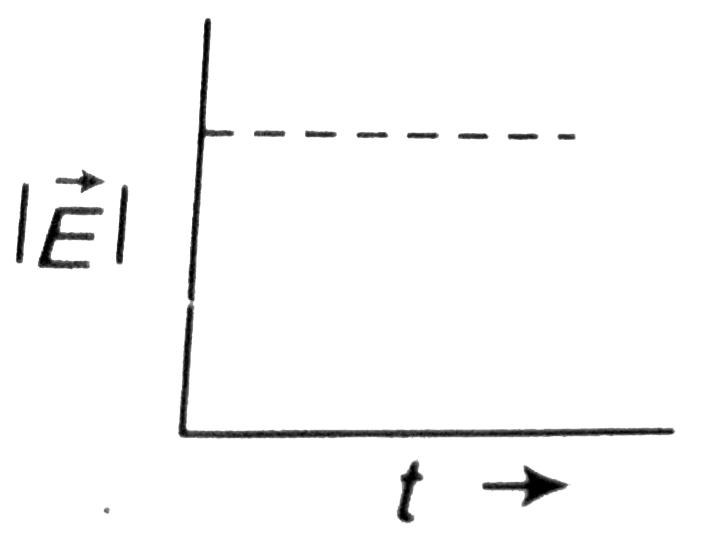 B
B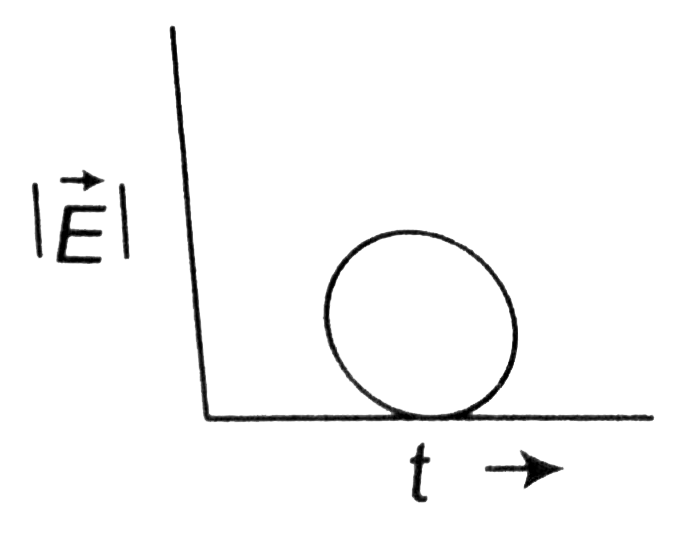 C
C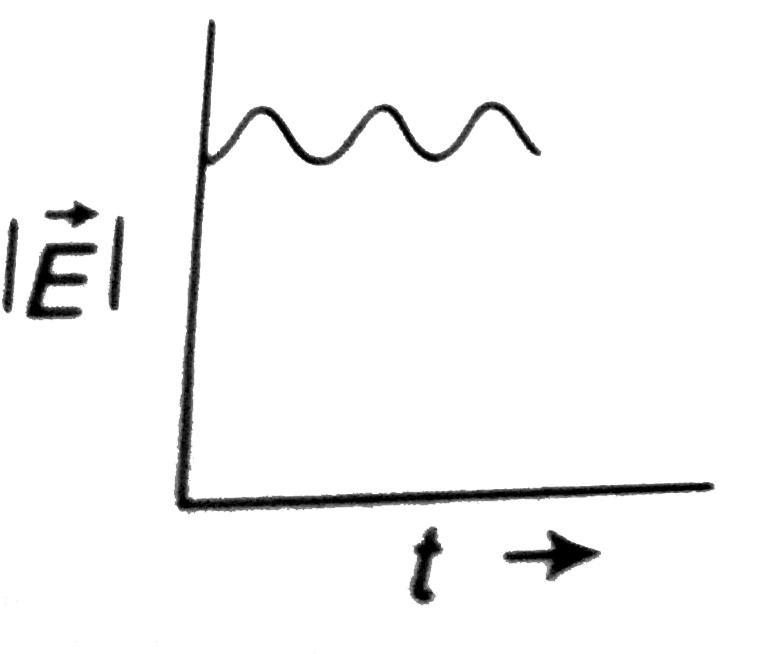 D
D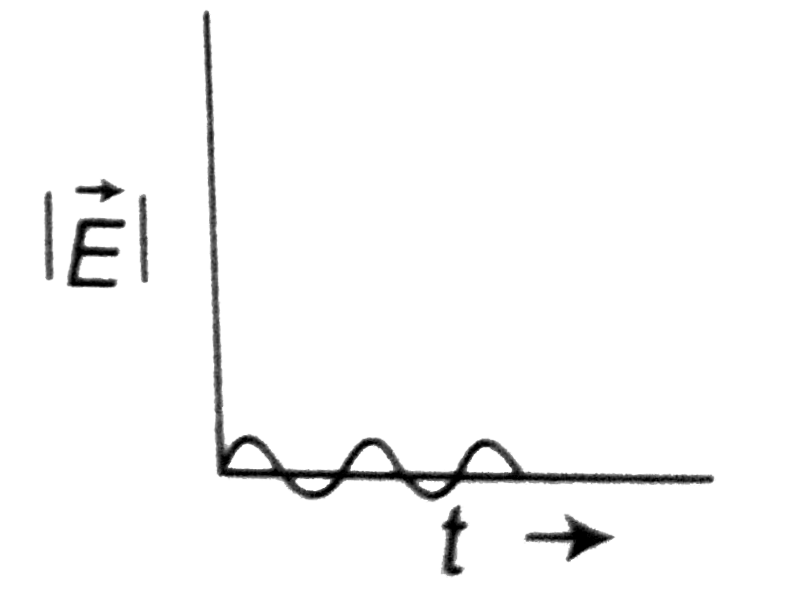
Which of the following diagram represents the variation of electric field vector with time for a circularly polarised light?
A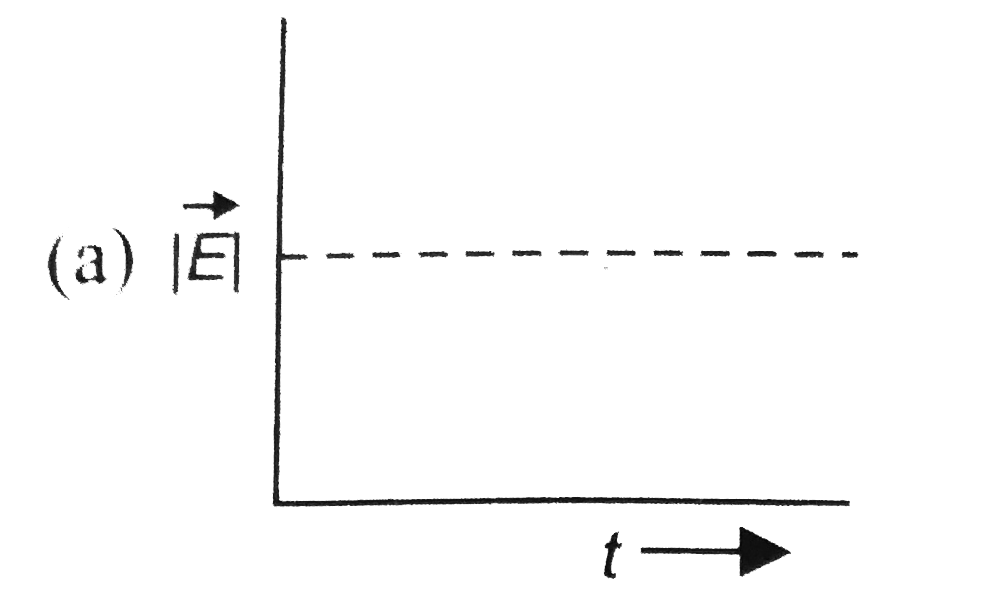 B
B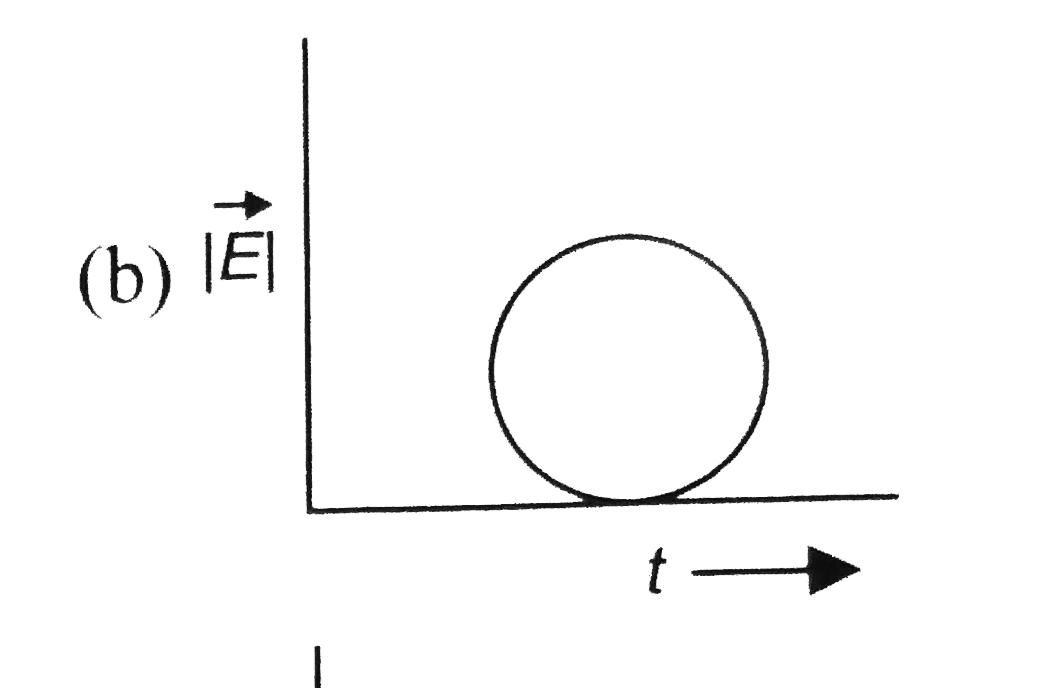 C
C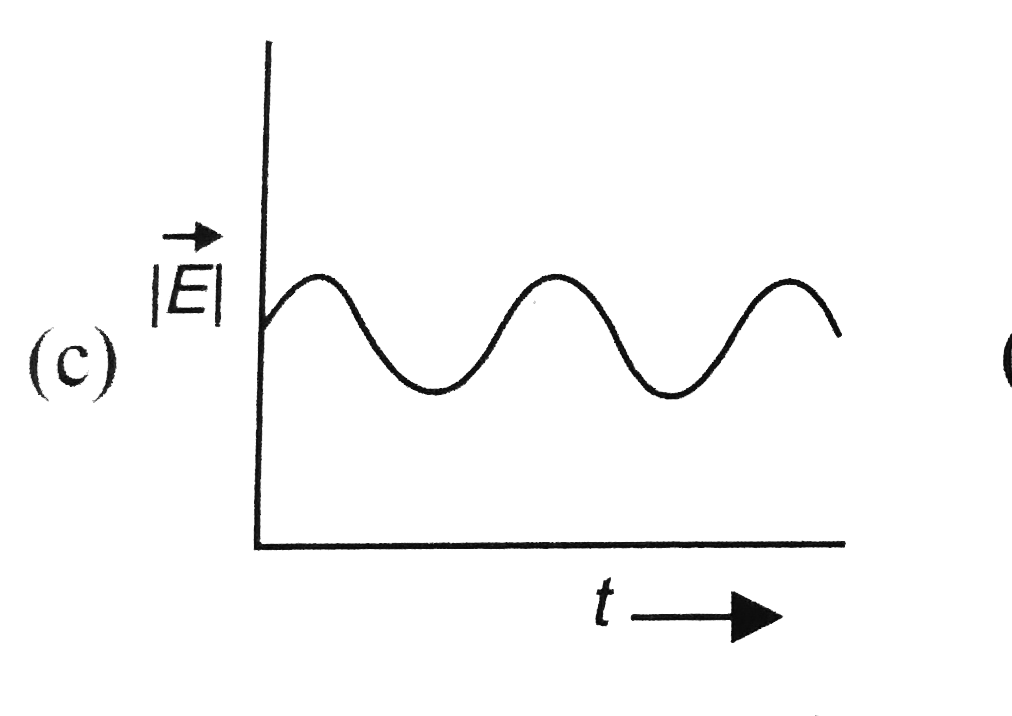 D
D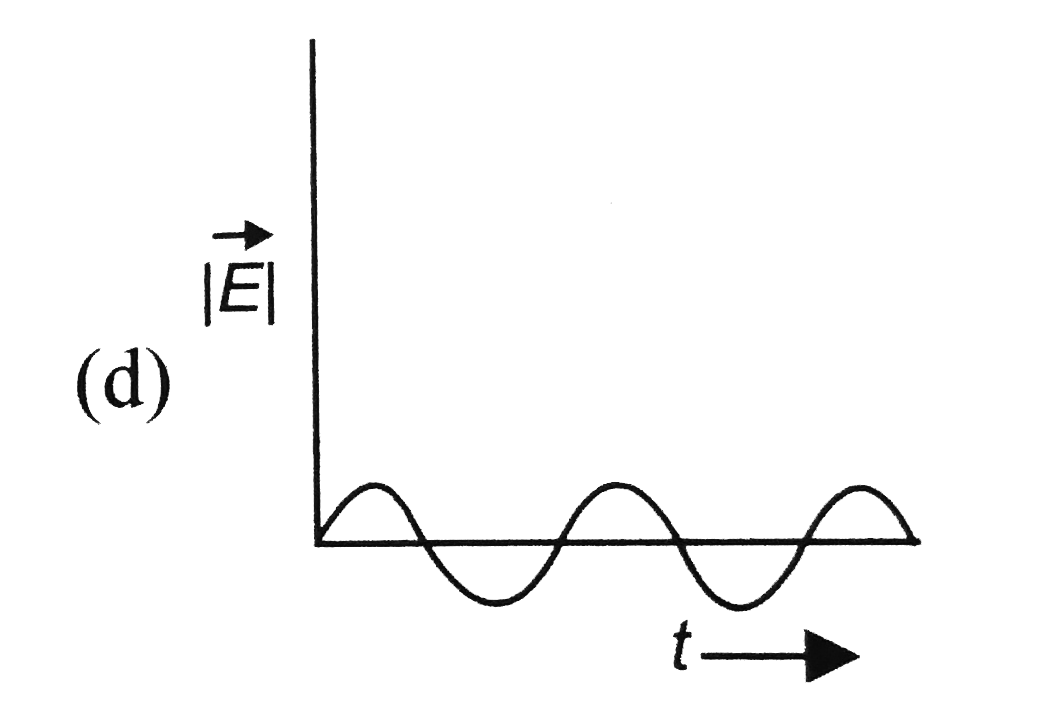
Which of the following represents electric polarisation ?
AP=1σPBP=σPCP=σPEDP=ε0σP
Which one of the following graphs represents the variation of electric field with distance r from the centre of a charged spherical conductor of radius R?
View SolutionWhich one of the following graphs represents the variation of electric field with distance r from the centre of a charged spherical conductor of radius R?
View SolutionWhich of the following represents a volt?
View SolutionWhich of the following represent electric field lines?
View SolutionWhich of the following graphs represents the variation of activity (A) of a radioactive substance with time (t).
View Solution
