Consider the Venn diagram given below:
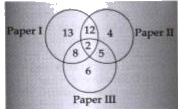
The number in the Venn diagram indicates the number of persons reading the newspapers.
The diagram is drawn after surveying 50 persons. In a population of 10,000. How many can be expected to read at least two newspapers ?
a. 5000
b. 5400
c. 6000
d. 6250
The correct Answer is:B
According to the given Venn diagram,
Number of persons who read atleast two newspapers = Number of persons who read two newspapers or more than two newspapers = 12 +2 +8 + 5 = 27.
So, out of 50 persons, 27 read atleast two newspapers.
Therefore, required number of such persons per 1000
=(2750×1000)=5400
Topper's Solved these Questions
- MATHEMATICAL ABILITY AND REASONINGBOOK - LUCENT PUBLICATIONCHAPTER - MATHEMATICAL ABILITY AND REASONINGEXERCISE - EXERCISE (Type-V: Data Based Problem)
6 Videos
- MATHEMATICAL ABILITY AND REASONINGBOOK - LUCENT PUBLICATIONCHAPTER - MATHEMATICAL ABILITY AND REASONINGEXERCISE - EXERCISE (Type-VI: Puzzle Based Problem)
22 Videos
- MATHEMATICAL ABILITY AND REASONINGBOOK - LUCENT PUBLICATIONCHAPTER - MATHEMATICAL ABILITY AND REASONINGEXERCISE - EXERCISE (Type-III: Age Based Problems)
11 Videos
- LOGICAL VENN DIAGRAMS BOOK - LUCENT PUBLICATIONCHAPTER - LOGICAL VENN DIAGRAMS EXERCISE - EXERCISE -4
3 Videos
- MATHEMATICAL OPERATIONS BOOK - LUCENT PUBLICATIONCHAPTER - MATHEMATICAL OPERATIONS EXERCISE - EXERCISE-3
34 Videos
Similar Questions
Consider the Venn diagram given below:
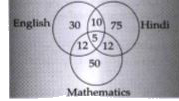
Five hundred candidates appeared in an examination comprising of tests in English, Hindi and Mathematics. The diagram gives the number of candidates who failed in different tests. What is the percentage of candidates who failed in at least two subjects ?
View SolutionStudy the diagram given below and answer the questions based on it
△ represents persons who like reading ∘ represents persons who like cycling □ represents persons who like trekking.
How many persons like reading?
View Solution
Knowledge Check
In the Venn diagram given below, the circle represents, 'Ladies', the triangle represents 'Constables' and the square represents 'Married person'. The numbers given in the diagram represents number of person of that particular category.
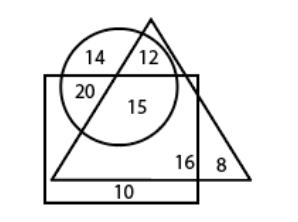
How many lady constables are NOT married ?A15B12C14D8In the given Venn diagram the reactangle represents women the pentagon represents entrepreneurs and the triangle represents mothers . The numbers given in the diagram represent the number of persons in that particular category .
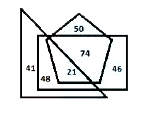
How many women are entrepreneurs but NOT mothers ?A50B74C46D21In the given Venn diagram, the ‘rectangle’ represents ‘engineers’, the ‘circle’ represents ‘managers’, and the ‘triangle’ represents ‘married’, The numbers given in the diagram represent the number of persons in that particular category.
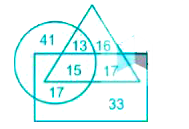
How many people are married but NOT engineers?A29B70C13D16
Study the diagram given below and answer the questions based on it
△ represents persons who like reading ∘ represents persons who like cycling □ represents persons who like trekking.
How many persons like trekking and reading but not cycling?
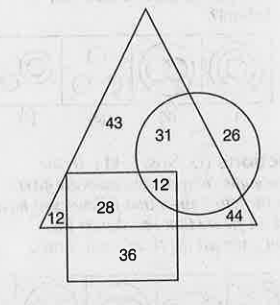
View SolutionStudy the diagram given below and answer the questions based on it
△ represents persons who like reading ∘ represents persons who like cycling □ represents persons who like trekking.
How many persons like reading and cycling but not trekking?
View SolutionSix Ps have to be placed in the squares of the diagram given below such that each column contains at least one P. In how many ways this can be done?

View SolutionThe given Venn diagram shows the number of students who have passed in the three exams, viz, english, science and Maths. How many students failed in all the three exams?
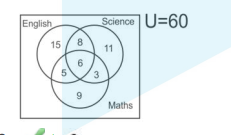
View SolutionIn the given Venn diagram, the pentagon repesents 'Cricketers'. The square represents Chese players and the circle represents 'Clerks'. The numbers given in the diagram represent the number of persons in that particular category.
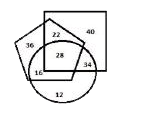
How many cricketers are chess playears but Not cierks ?
View Solution

