The given Venn diagram shows the number of students who have passed in the three exams, viz, english, science and Maths. How many students failed in all the three exams?
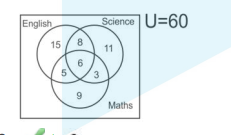
3
6
12
9
Step by step video & image solution for The given Venn diagram shows the number of students who have passed in the three exams, viz, english, science and Maths. How many students failed in all the three exams? by Maths experts to help you in doubts & scoring excellent marks in Class 14 exams.
Similar Questions
In the following Venn diagram the total number of students who play all the three games is:
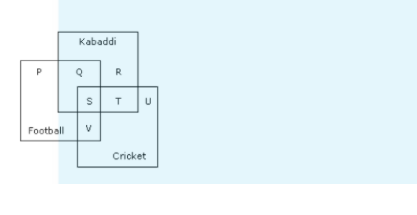 View Solution
The given Venn diagram represent the number of students in a class who study three languages, French Spanish and Japanese.
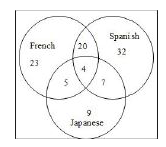
The number of students studying French, Spanish and Japanese is:View Solution
Knowledge Check
- Question 1 - Select One
In a class of 25 students, 18 of them passed in maths, 14 of them passed in Science and 3 of them failed in both the exams. How many students passed in both the exams ?
A3B4C10D11 - Question 2 - Select One
For an examination consisting of three subjects -Maths Physics and Chemistry, 280 students appeared. When the results were declared, 185 students had passed in Maths, 210 had passed in Physics and 222 had passed in Chemistry.
All those except 5 students who passed in Maths, passed in Physics.
All those except 10 students who passed in Maths, passed in Chemistry.
47 students failed in all the three subjects.
200 students who passed in Physics also passed in Chemistry :
How many students passed in all the three subjects ?A185B175C170D171 - Question 3 - Select One
Manoj is one of the students who …....... passed the exam.
AhaveBhasChadDwould have
The following pie-chart shows the number of students who failed in different subjects in an examination. Examine the chart and answer the following questions. The total number of students who have failed is 500.
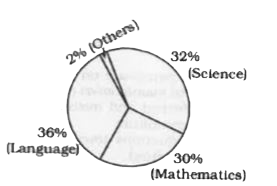
The number of students failed in science is less than the number of students failed in all other subjects by :View SolutionDirection :- The following pie-chart shows the number of students who failed in different subjects in an examination. Examine the chart and answer the following questions. The total number of students who have failed is 500.
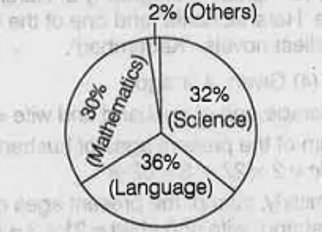
The number of students failed in Science is less than the number of student failed in all other subects byView SolutionOut of 180 students in a class 7 students failed in all the three subjects viz , Physics , Chemistry , Maths. Only 144 students pass in only subject and 21 students and 21 students pass in only tow subjects.
(a) How many students passed in all the three subject ?
(b) How many students passed in at most tow subjects but atleast in one subject ?View SolutionThe given Venn diagram shows a total of 50 students who appeared for three different examinations : A, B, and C. All have appeared for at least one examination. How many appeared for examination A and B but not C ?
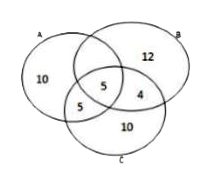 View Solution
The given Venn diagram represents results of a class students:
The triangle represents students who scored 85% and above in Maths, the circle represents students who scored 85% and above in English, the rectangle represents students who scored 85% and above in Science, and the square represents students who scored 85% and above in Social Science. The numbers given in the diagram represent the number of students in that particular category.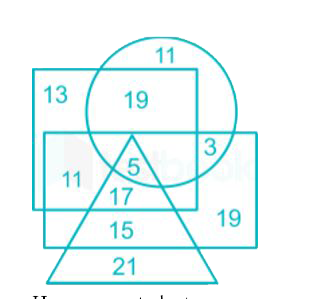
How many students scored 85% and above in all the subjects?View Solution

