Draw scatter diagram for the data given below and interpret it.

Text Solution
The correct Answer is:Positive correlation
|
Similar Questions
Knowledge Check
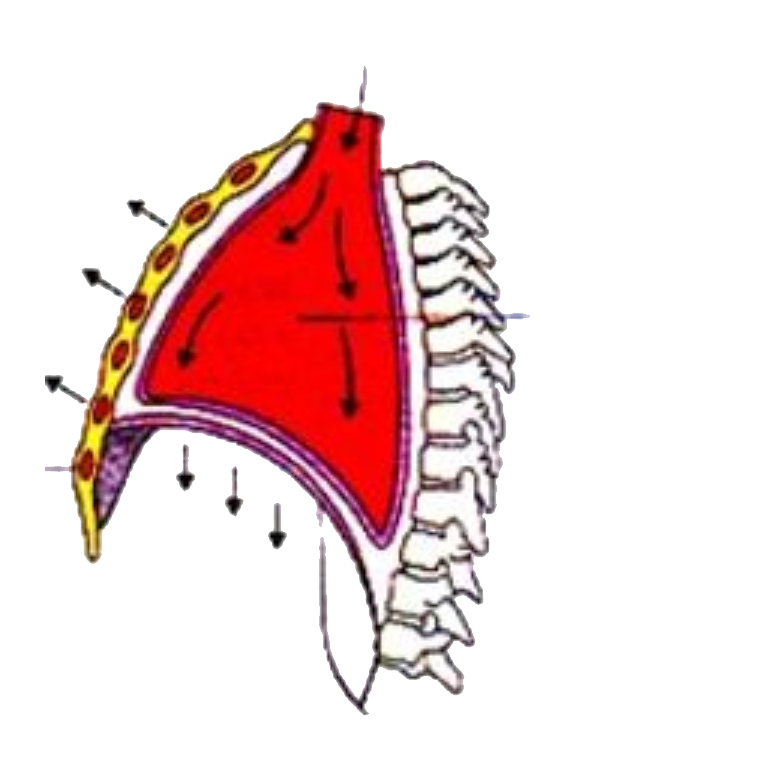
The diagram given below represents
 AinspirationBexpirationCSystoleDdiastole
Draw a diplacement-time graph for the data given below with respect to a particle moving in a straight line

View SolutionDraw a pictograph to represent the data given below :

View SolutionMake a scattered diagram of the given below. Does any relationship exist between the two ?

View SolutionThe diagram given below represents

View SolutionModal class for the data given below is ________.

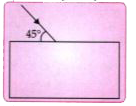
View SolutionDraw the diagram given below and clearly show the path taken by the emergent ray:

View SolutionDraw a block diagram for data transmission .
View Solution

