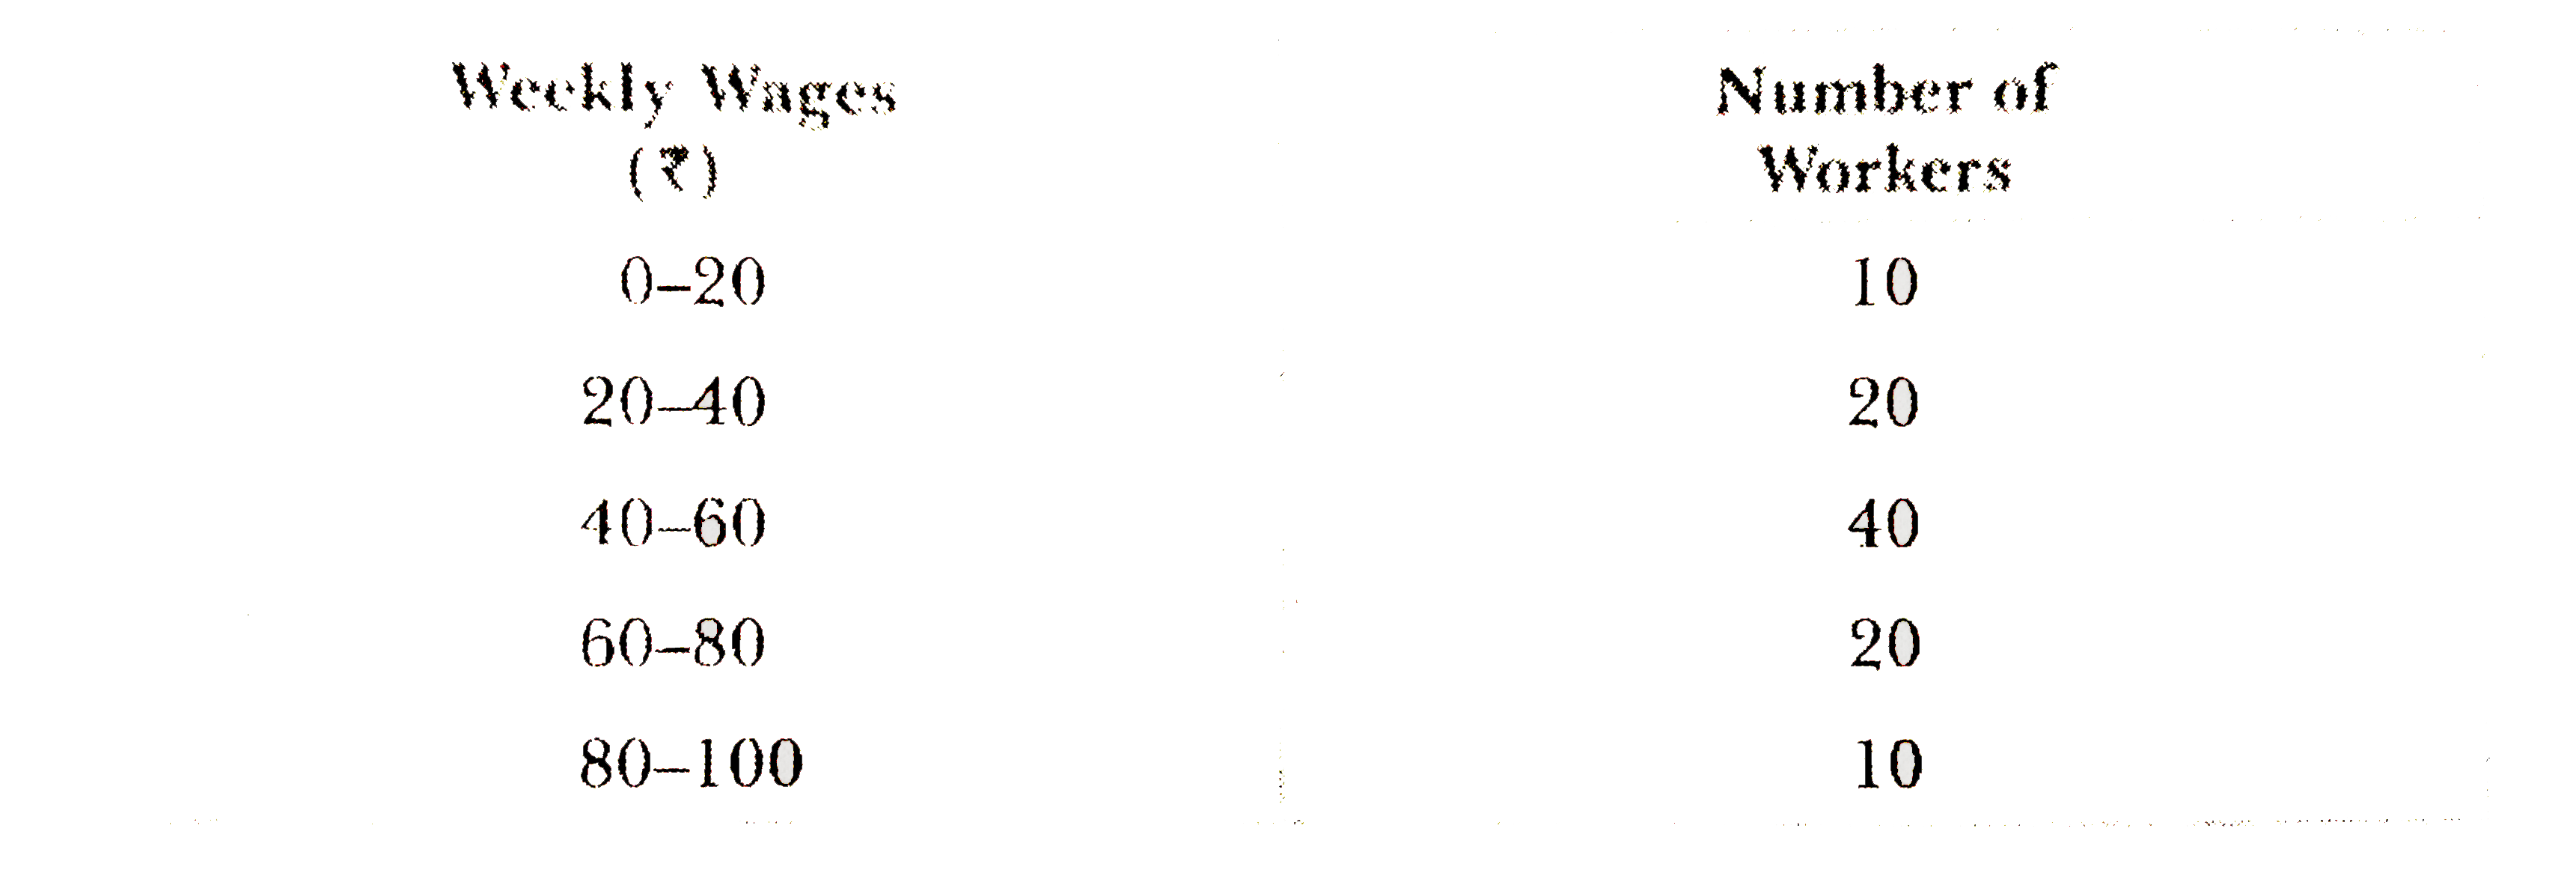
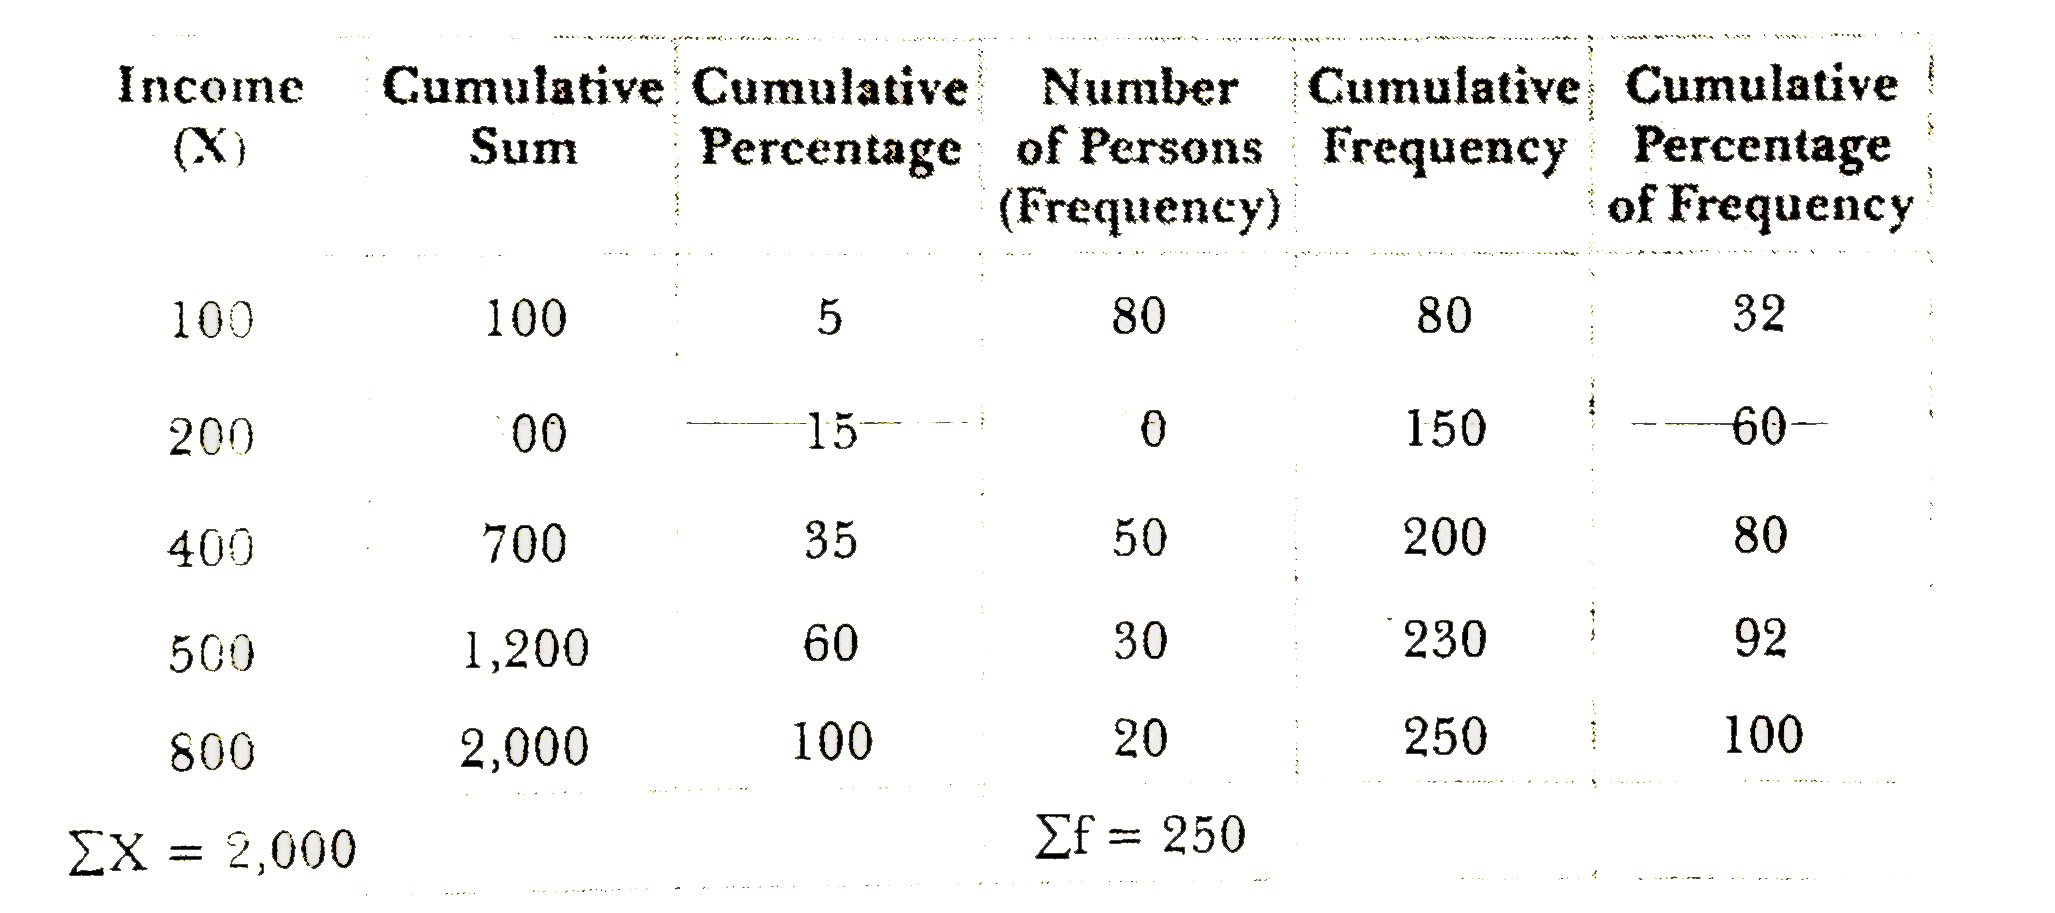
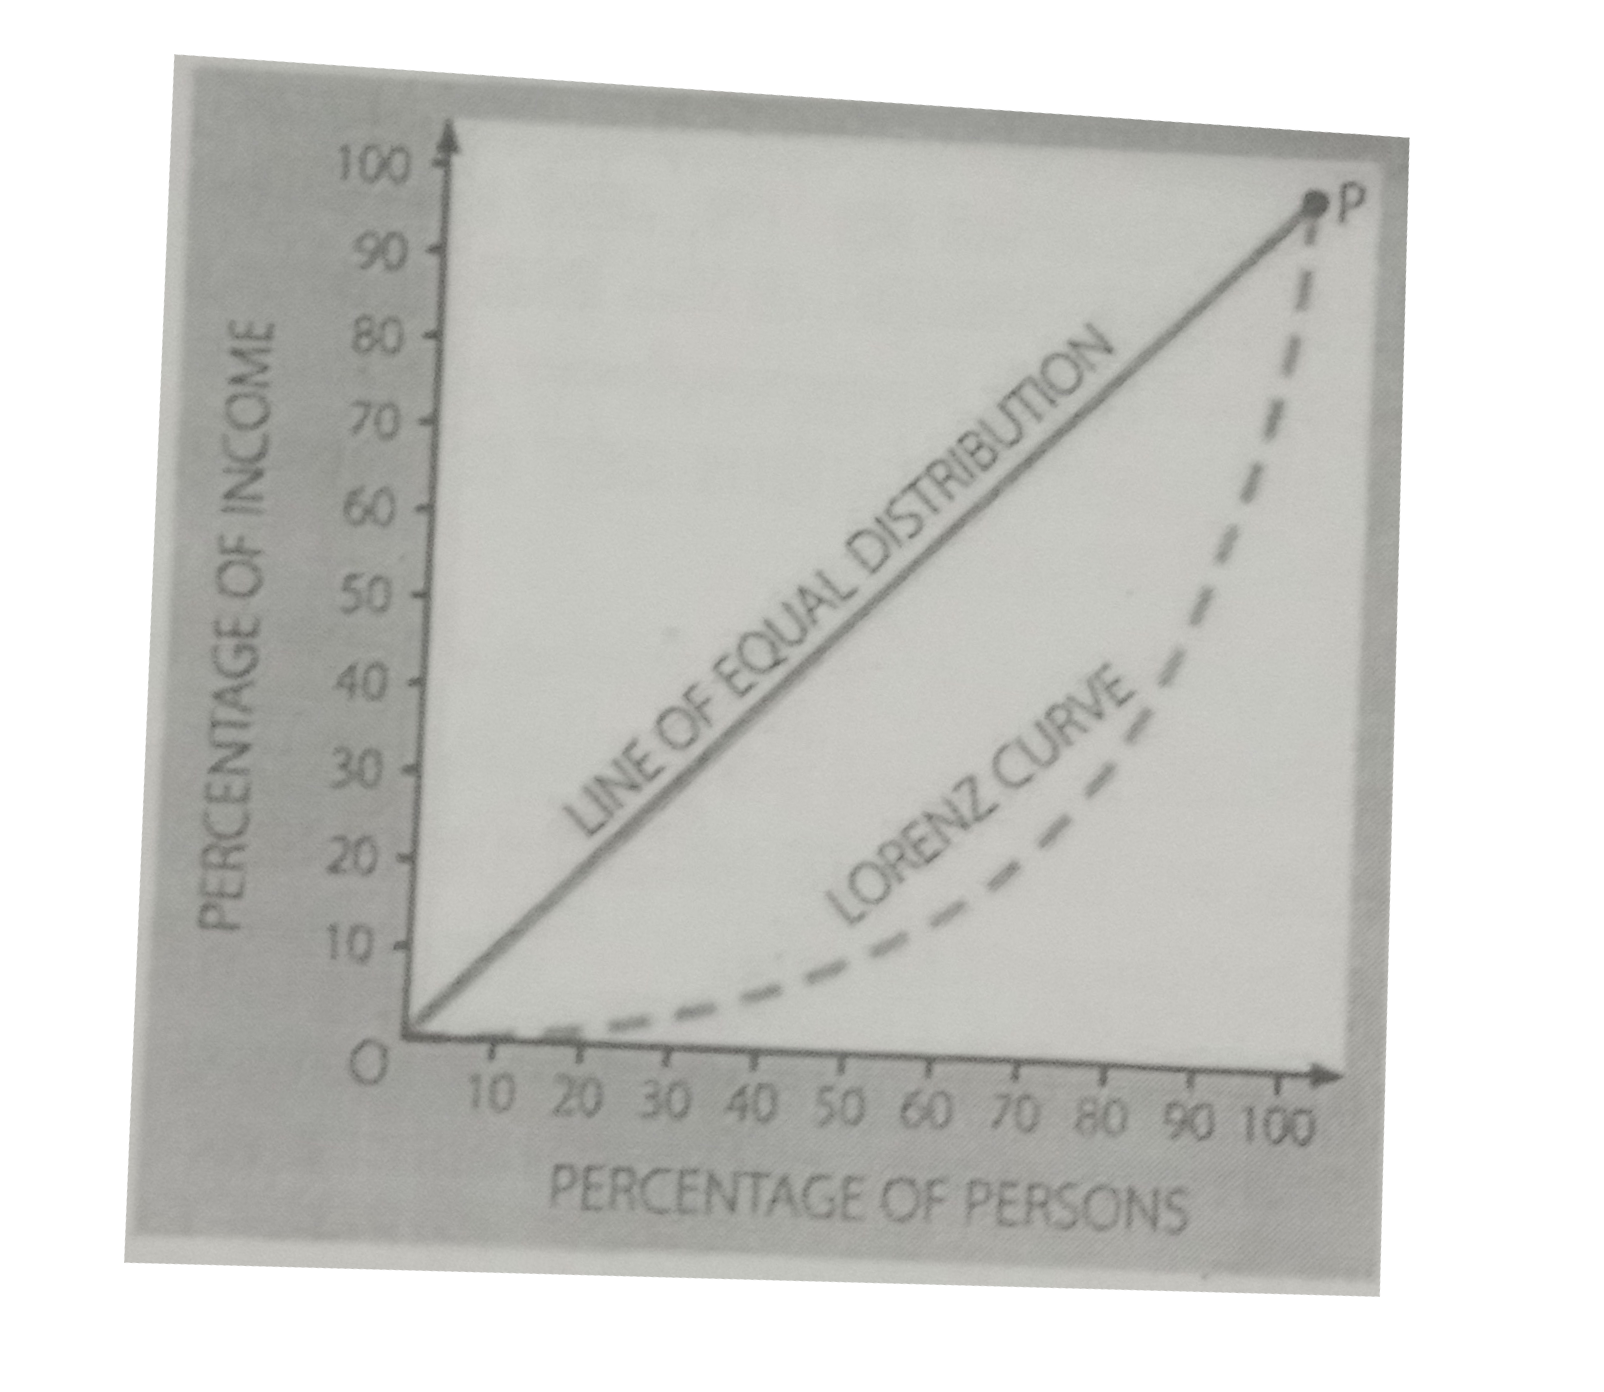
Draw a Lorenz curve of the data given below:

Topper's Solved these Questions
- MEASURES OF DISPERSIONBOOK - TARUN JAIN & VK OHRICHAPTER - MEASURES OF DISPERSIONEXERCISE - Miscellaneous Illustrations
24 Videos
- MEASURES OF DISPERSIONBOOK - TARUN JAIN & VK OHRICHAPTER - MEASURES OF DISPERSIONEXERCISE - EXERCISE
12 Videos
- MEASURES OF CENTRAL TENDENCY MEDIAN AND MODEBOOK - TARUN JAIN & VK OHRICHAPTER - MEASURES OF CENTRAL TENDENCY MEDIAN AND MODEEXERCISE - NCERT Questions (With Hints to Answers)
5 Videos
- ORGANISATION OF DATABOOK - TARUN JAIN & VK OHRICHAPTER - ORGANISATION OF DATAEXERCISE - EXERCISE NCERT
13 Videos
Similar Questions
The following data on the number of girls (to the nearest ten) per thousand boys in different sections of Indian society is given below. Draw bar graph for the the data given below.
View SolutionCalculate the mean and variance from the data given below:

View SolutionWhich one of the following is the mean of the data given below:

View SolutionDraw the logic symbol of the gate given below:

View SolutionDraw a pictograph to represent the data given below :

View SolutionDraw the 'less than' and 'more than' ogive on the same graph paper from the data given below :

View SolutionDraw the 'less than' and 'more than' ogive on the same graph paper from the data given below :

View SolutionWhat is a lorenz curve?
View SolutionThe Median class of the data given below is ________.

View SolutionDraw a diplacement-time graph for the data given below with respect to a particle moving in a straight line

View Solution


