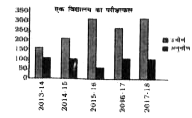
In the adjacent double bar graph number of students of a class are shown according in academic year
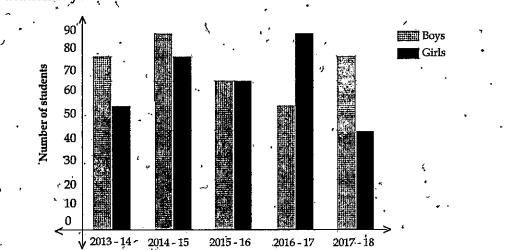
Answer the question on the basis of this double bar graph.
What was the total number of students In the school in the academic year 2013-2014?Solution in Telugu
Total number of students in the academic year 2013-2014 was=70+50=120
Topper's Solved these Questions
Similar Questions
Write the following fractions in ascending order '3/2,5/2,1/2,17/2,9/2'
05:41View SolutionMatch the following Column A to Column B
 02:10View Solution
The inequation represented by the graph given below is :
02:17View SolutionThe inequation that best describes the graph given below is _________
02:10View SolutionThe inequation that best describes the following graph is _________
03:14View SolutionThe given bar graph presents the results in terms of number of students in a school for the five academic year 2013-2014 to 2017-2018.
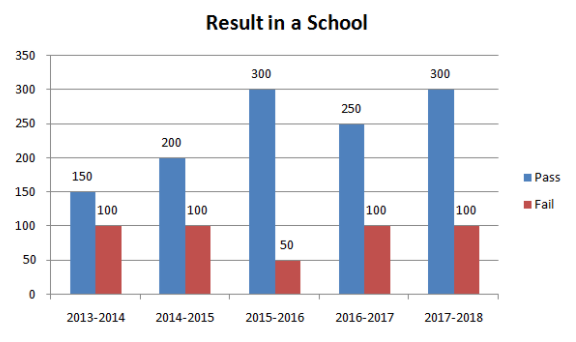
In which year the percentage increase in the total number of students is the highest in a comparison to the previous academic year?02:08View SolutionThe given bar graph presents the results in terms of the number of students in a school of the five academic years, 2013-2014 to 2017-2018.
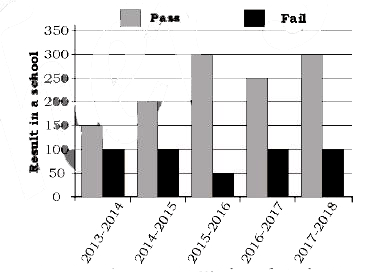
What is the average number of students who passed in the five academic years?View SolutionThe given bar graph (bar graph) shows the results of a school in terms of number of students during five academic years, 2013-2014 to 2017-2018. Which year has the highest percentage increase in the total number of students as compared to the previous academic year?
02:05View SolutionThe given bar graph (bar graph) shows the number of students with reference to the results of a school during the five academic years, 2013-2014 to 2017-2018. What is the average number of students passed in five academic years?
03:19View Solutionदिया गया दंड आरेख (बार ग्राफ ) पाँच शैक्षणिक वर्षों, 2013−2014 से 2017−2018 के दौरान किसी स्कूल के परीक्षाफल को विद्यार्थियों की संख्या के रूप में दर्शाता है।
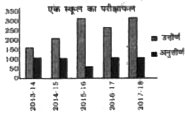
पिछले शैक्षणिक वर्ष की तुलना में किस वर्ष, विद्यार्थियों की संख्या के रूप में दर्शाता है ?03:39View Solutionदिया गया दंड आरेख (बार ग्राफ ) पाँच शैक्षणिक वर्षों, 2013−2014 से 2017−2018 के दौरान किसी स्कूल के परीक्षाफल को विद्यार्थियों की संख्या के रूप में दर्शाता है।
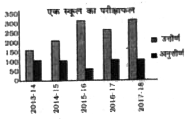
पाँच शैक्षणिक वर्षों में अनुत्तीर्ण हुए विद्यार्थियों का औसत क्या है ?05:24View Solutionदिया गया दंड आरेख (बार ग्राफ ) पाँच शैक्षणिक वर्षों, 2013−2014 से 2017−2018 के दौरान किसी स्कूल के परीक्षाफल को विद्यार्थियों की संख्या के रूप में दर्शाता है।
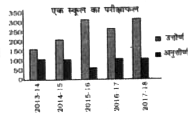
उत्तीर्ण छात्रों की संख्या और अनुत्तीर्ण होने वालों के बीच का अंतर किस शैक्षणिक वर्ष में सबसे अधिक है ?06:04View Solutionदिया गया दंड आरेख (बार ग्राफ ) पाँच शैक्षणिक वर्षों, 2013−2014 से 2017−2018 के दौरान किसी स्कूल के परीक्षाफल को विद्यार्थियों की संख्या के रूप में दर्शाता है।
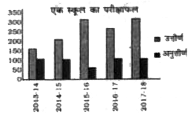
पाँच शैक्षणिक वर्षों के दौरान उत्तीर्ण विद्यार्थियों का अनुमानित प्रतिशत (निकटतम पूर्णांक में ) कितना है ?03:11View Solutionदिया गया दंड आरेख (बार ग्राफ ) पाँच शैक्षणिक वर्षों 2013−2014 से 2017−2018 तक के दौरान एक स्कूल के परीक्षाफल के संदर्भ में विद्यार्थियों की संख्या को दर्शाता है।
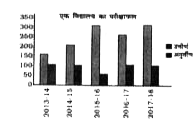
पाँच शैक्षणिक वर्षों में उत्तीर्ण होने वाले विद्यार्थियों की औसत संख्या क्या है ?02:56View Solutionदिया गया दंड आरेख (बार ग्राफ ) पाँच शैक्षणिक वर्षों 2013−2014 से 2017−2018 तक के दौरान एक स्कूल के परीक्षाफल के संदर्भ में विद्यार्थियों की संख्या को दर्शाता है।
विद्यार्थियों की कुल संख्या में प्रतिशत वृद्धि, पिछले शैक्षणिक वर्ष की तुलना में किस वर्ष सबसे कम है ?06:32View SolutionGiven bar graph (bar graph) for five academic years 2013-2014 From 2017-2018 Refers to the number of students with reference to the results of a school during the period. What is the approximate percentage (rounded off) of total students who failed during all the five academic years?
05:36View Solution

