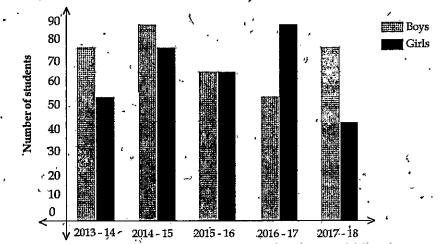
In the adjacent double bar graph number of students of a class are shown according in academic year

Answer the question on the basis of this double bar graph.
IN which academic year number of both girls and boys in the school were equal ?Solution in Telugu
In 2015-2016 academic year number of both girls and boys in the school were equal
Topper's Solved these Questions
Similar Questions
Write the following fractions in ascending order '3/2,5/2,1/2,17/2,9/2'
View SolutionDetermine the point of symmetry of a regular hexagon.
View SolutionMatch the following Column A to Column B

View SolutionMatch the following Column A to Column B

View SolutionMatch the following Column A to Column B

View SolutionThe inequation represented by the graph given below is :
View SolutionThe inequation that best describes the graph given below is _________
View SolutionThe inequation that best describes the following graph is _________
View SolutionIn the given figure, PQRS is a parallelogram. A and B are the mid-point of ¯¯¯¯¯¯PQ and ¯¯¯¯¯SR respectively. If PS=BR, then the quadrilateral ADBC is a…………………… ,
ltimg src="https://d10lpgp6xz60nq.cloudfront.net/physics_images/PS_MATH_IX_C12_E05_020_Q01.png" width="80%"gt
View SolutionMagnitude of slope i.e. steepness of graph shown in figure ltimg src="https://d10lpgp6xz60nq.cloudfront.net/physics_images/ALN_PHY_R04_E01_026_Q01.png" width="80%"gt
View Solutionविभिन्न शैक्षणिक सत्रों (academic Years ) में किसी स्कूल की नवी कक्षा में छात्रों की संख्या निम्न सारणी में दी गई है :

उपरोक्त आँकड़ों का एक दंड आलेख बनाइए ।
View SolutionMagnitude of slope i.e. steepness of graph shown in figure
ltimg src="https://d10lpgp6xz60nq.cloudfront.net/physics_images/ALN_PHY_R04_E01_026_Q01.png" width="80%"gt
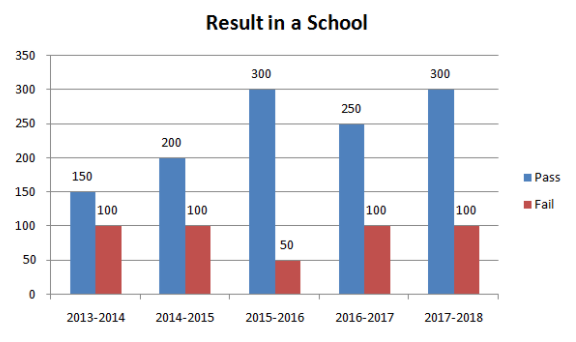
View SolutionThe given bar graph presents the results in terms of number of students in a school for the five academic year 2013-2014 to 2017-2018.

In which year the percentage increase in the total number of students is the highest in a comparison to the previous academic year?
View SolutionThe given bar graph (bar graph) shows the number of students with reference to the results of a school during the five academic years, 2013-2014 to 2017-2018. What is the average number of students passed in five academic years?
View Solution'A' is the portion of adenophypophysis which secrets different hormones 'A' is____
View Solutionदिया गया दंड आरेख (बार ग्राफ ) पाँच शैक्षणिक वर्षों, 2013−2014 से 2017−2018 के दौरान किसी स्कूल के परीक्षाफल को विद्यार्थियों की संख्या के रूप में दर्शाता है।

पिछले शैक्षणिक वर्ष की तुलना में किस वर्ष, विद्यार्थियों की संख्या के रूप में दर्शाता है ?
View Solution
