The given chart shows men’s and women’s average daily earning in Company X.
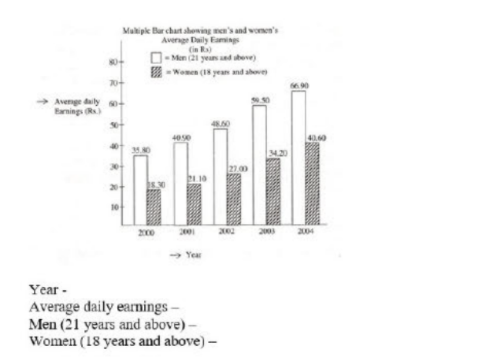
Based on the depicted data, in which year was the percentage increase of the average daily earning of men maximum over the preceding year?
2003
2001
2002
2004
Step by step video & image solution for The given chart shows men’s and women’s average daily earning in Company X. Based on the depicted data, in which year was the percentage increase of the average daily earning of men maximum over the preceding year? by Reasoning experts to help you in doubts & scoring excellent marks in Class 14 exams.
Similar Questions
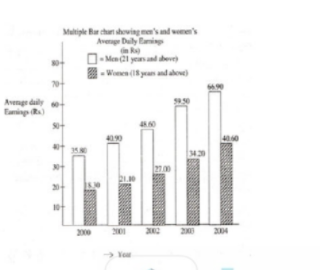
The chart shows men and women’s average daily earning in company X. The difference between the average daily earning between men and women over the successive year is:
 View Solution
The given bar chart shows the sales for sets of television of three companies in three years
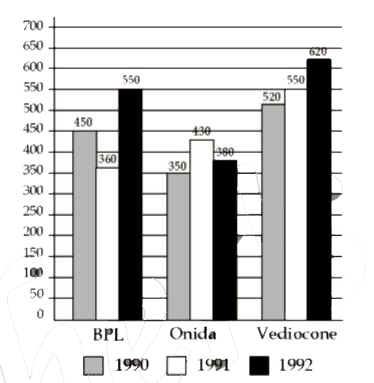
In the given bar chart, what is a difference between the average sales of television BPL and Onida for 3 yearsView Solution
Knowledge Check
- Question 1 - Select One
The following table shows the annual profit of a company (in Rs. lakh).

The period which has the maximum percentage increase in profit over the previous year is:A2018-2019B2015-2016C2017-2018D2016-2017 - Question 2 - Select One
Read the following graph carefully and answer the questions given below.
Production of sugar in three different factories over years (in thousand tonnes)
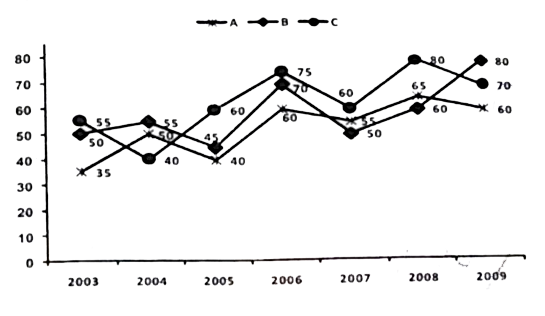
In which year was the percentage increase/decrease in production of company B maximum ?A2008B2005C2007Dnone of these - Question 3 - Select One
Comprehension: Study the bar chart and answer the questions based on it.
Production of Pesticides by Coromandal International Ltd. Company (in 1000 tonnes)
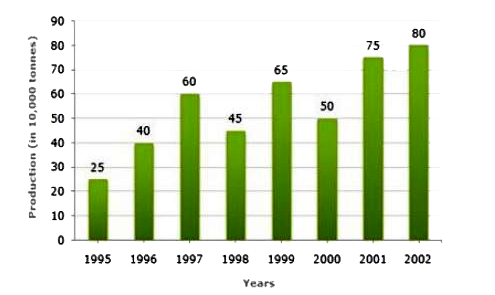
In which year was the percentage increase in production as compared to the previous year the maximum?
A. 2002
B. 2001
C. 1997
D. 1996ACBDCADB
The average age of a group of men and women is 30years. If average age of men is 32 and that of women is 27, then the percentage of women in the group is-
View SolutionThe line chart given below shows the profit (in crores) of a company for the years 2008 to 2015.
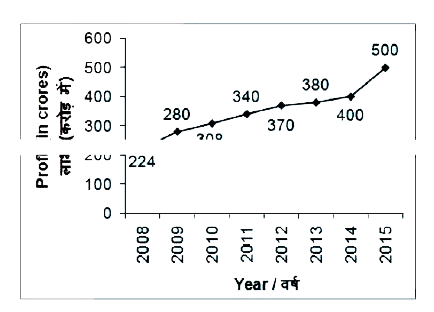
What is the percentage increase in profit in the year 2010 in comparison to the previous year ?View SolutionThis table shows the percentage of students passing out of five different colleges over three years. It is given that from each college, 200 students appeared every year.
यह तालिका तीन वर्षों में पांच अलग-अलग कॉलेजों से पास करने वाले छात्रों का प्रतिशत दर्शाती है | यह दिया गया है कि प्रत्येक कॉलेज से हर वर्ष 200 छात्र शामिल हुए |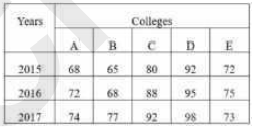 In which college the average percentage of passing students over the given three years is the
least?
किस कॉलेज में दिए गए तीन वर्षों के दौरान पास करने वाले छात्रों का औसत प्रतिशत सबसे कम रहा है ?View SolutionStudy the following graph to answer the given questions.
Per cent profit earned by two companies over the given years

For Company Y, which year is the percent of increase in percent profit over that of previous year the highest?View SolutionThe bar chart given below shows the revenue (in crores) of company A for the years 2008 to 2015.
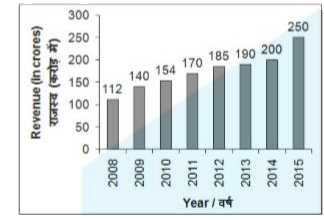
What is the percentage increase in revenue in the year 2010 in comparison to the previous year?View Solution

